Fig. 20
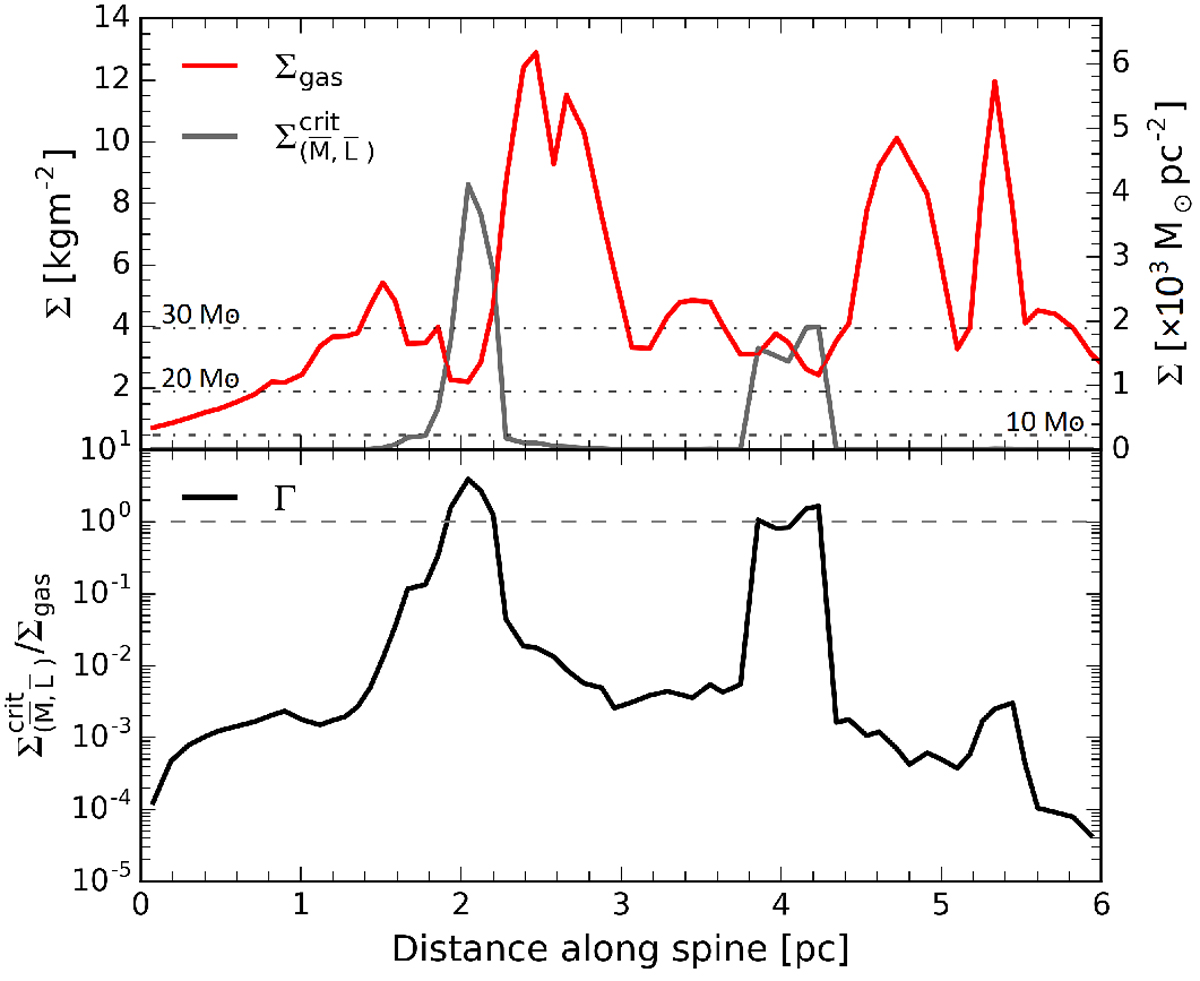
Gas surface density (solid red) and estimated critical gas surface density (solid grey) for the active part of G316.75 (top), and corresponding Eddington ratio (bottom). We note that here, the gas surface density is only half of the observed G316.75 mass surface density as massive stars are assumed to be located at the centre of the ridge. Grey dash-dotted lines in the top panel labeled as 30, 20 and 10 M⊙ show the critical gas surface density if a star of that mass were placed every ~0.08 pc (in every pixel) along the ridge spine. The horizontal grey-dashed line in the bottom panel shows where the Eddington ratio is equal to 1.
Current usage metrics show cumulative count of Article Views (full-text article views including HTML views, PDF and ePub downloads, according to the available data) and Abstracts Views on Vision4Press platform.
Data correspond to usage on the plateform after 2015. The current usage metrics is available 48-96 hours after online publication and is updated daily on week days.
Initial download of the metrics may take a while.