Fig. 2
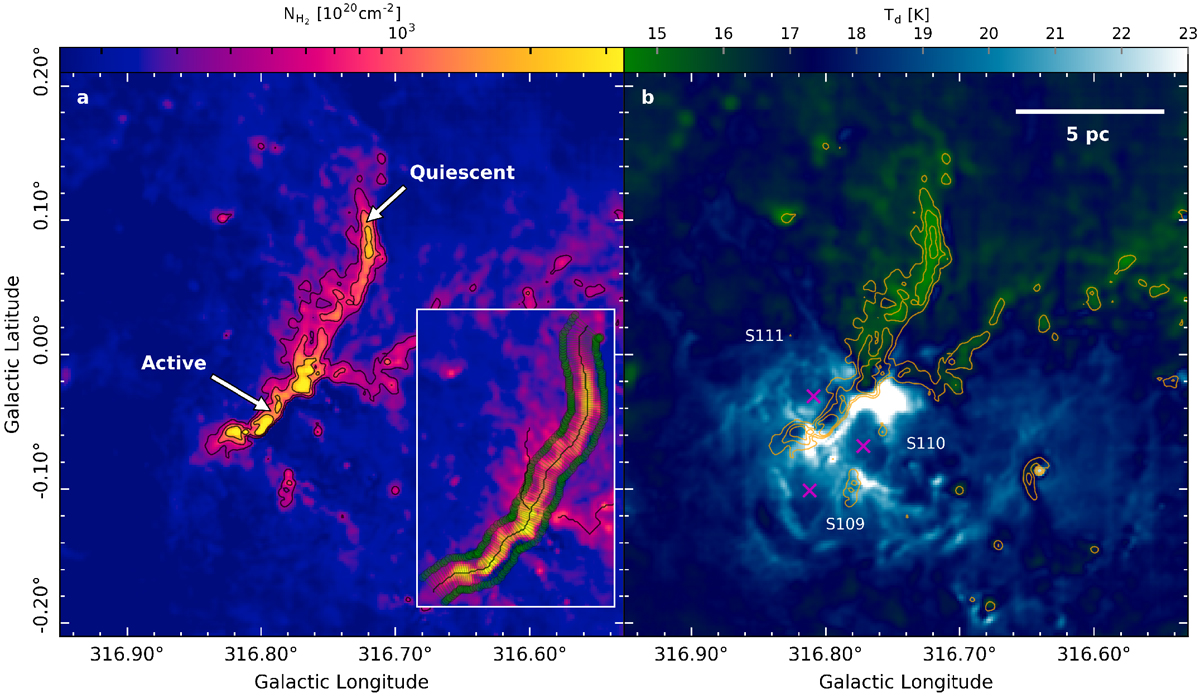
H2 Column density map (a) and dust temperature map (b) derived using PPMAP. The black contours on (a) and the orange contours on (b) show H2 column density contours at 400, 800 and 1600 × 1020 cm−2. In axes figure shows the three spines traced by Hessian methods as solid black lines. Green-dashed lines show the perpendicular cuts along the ridge offset from the spine centre by 0.63 pc. Theses are used for further analysis. Labeled arrows point toward the active and quiescent parts of the filament and labeled magenta crosses show the location of three bubbles, S109, S110, and S111, cataloged in Churchwell et al. (2006). The white solid line indicates a physical scale of 5 pc.
Current usage metrics show cumulative count of Article Views (full-text article views including HTML views, PDF and ePub downloads, according to the available data) and Abstracts Views on Vision4Press platform.
Data correspond to usage on the plateform after 2015. The current usage metrics is available 48-96 hours after online publication and is updated daily on week days.
Initial download of the metrics may take a while.