Fig. 19
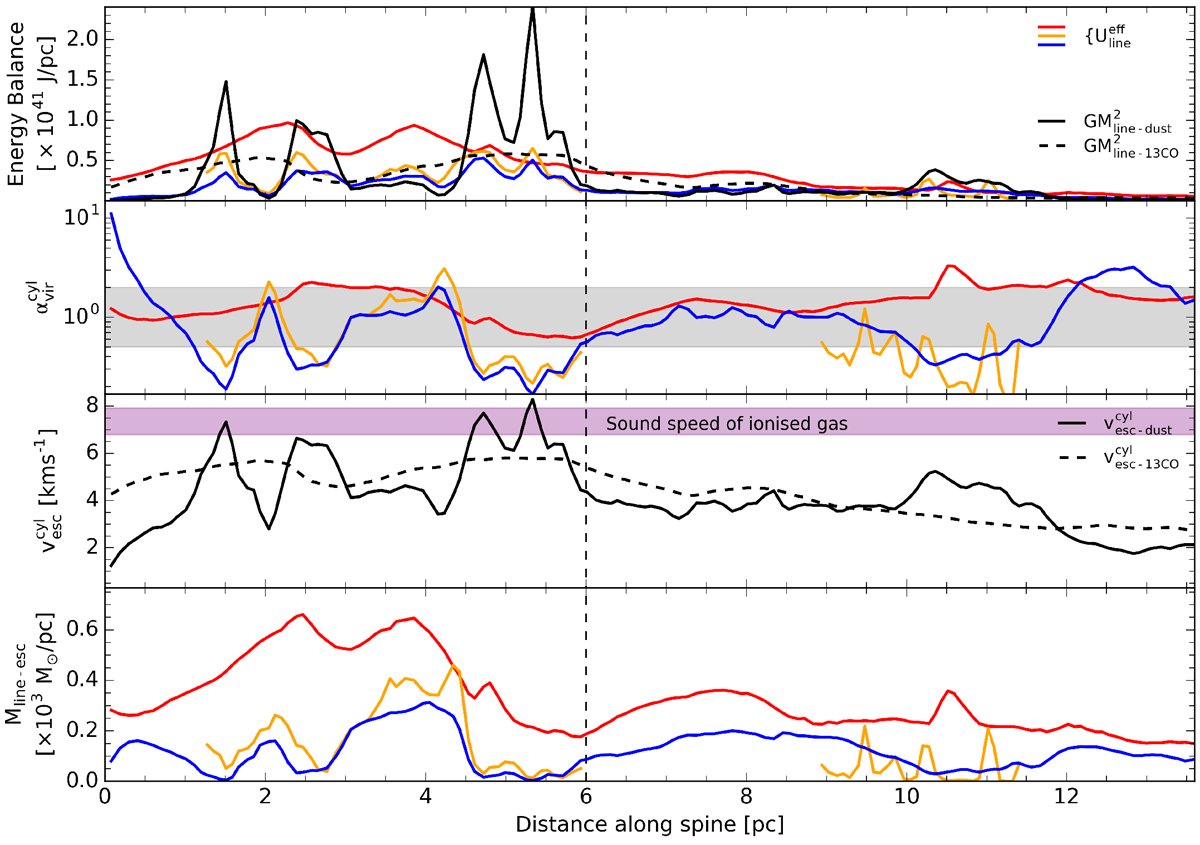
First panel: kinetic energy per unit line as estimated using the same molecular transitions and line colours as shown in Fig. 13. Also plotted is
![]() (which is proportional to the potential energy per unit line Ωline) calculated using Herschel (black solid line) and 13CO (1–0) (black dashed line). Second panel: virial ratio as estimated using the same three molecular transitions. The grey shaded region highlights where the gas has a virial ratio between 0.5 and 2. Third panel: escape velocity as estimated using Mline-dust (solid line) and Mline-13CO (dashed line). The purple shaded region indicates the thermal sound speed of ionised gas at Te = 5600–7600 K. Fourth panel: mass-per-unit-length that can escape the potential calculated using the same three molecular transitions.
(which is proportional to the potential energy per unit line Ωline) calculated using Herschel (black solid line) and 13CO (1–0) (black dashed line). Second panel: virial ratio as estimated using the same three molecular transitions. The grey shaded region highlights where the gas has a virial ratio between 0.5 and 2. Third panel: escape velocity as estimated using Mline-dust (solid line) and Mline-13CO (dashed line). The purple shaded region indicates the thermal sound speed of ionised gas at Te = 5600–7600 K. Fourth panel: mass-per-unit-length that can escape the potential calculated using the same three molecular transitions.
Current usage metrics show cumulative count of Article Views (full-text article views including HTML views, PDF and ePub downloads, according to the available data) and Abstracts Views on Vision4Press platform.
Data correspond to usage on the plateform after 2015. The current usage metrics is available 48-96 hours after online publication and is updated daily on week days.
Initial download of the metrics may take a while.