Fig. 18
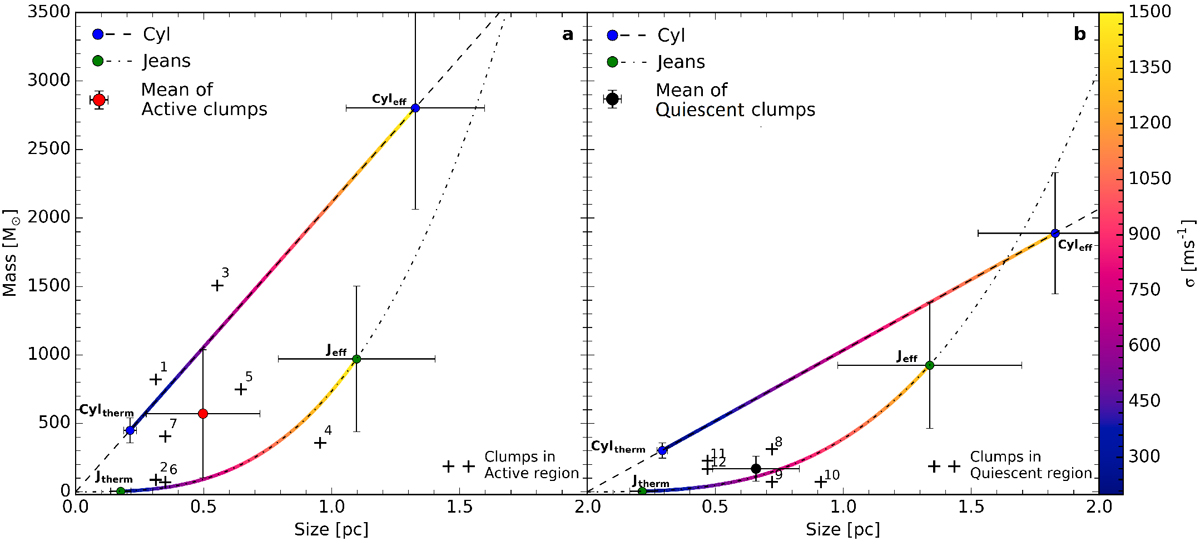
Fragmentation scales (both mass and length) for increasing values of velocity dispersion for the active (a) and quiescent (b) regions calculated using Herschel column density. The dashed-black line shows the cylindrical fragmentation case, while the dashed-dotted-black line shows the Jeans fragmentation case. The mass and length calculated for thermal and effectivefragmentation modes are shown as blue and green circles. The coloured lines show how the mass and length fragmentation scales change with increasing velocity dispersion (from thermal to effective velocity dispersion). The black pluses show the mass and minimum separation of the clumps tabulated in Table 2. The numbers ascribed to the clumps match the numbering given in Table 2. The red circle marks the mean mass and minimum separation of the clumps for the active region, and the black circle marks the mean mass and minimum separation of the clumps for the quiescent region. The errorbars for the mean show the 1-sigma spread in values.
Current usage metrics show cumulative count of Article Views (full-text article views including HTML views, PDF and ePub downloads, according to the available data) and Abstracts Views on Vision4Press platform.
Data correspond to usage on the plateform after 2015. The current usage metrics is available 48-96 hours after online publication and is updated daily on week days.
Initial download of the metrics may take a while.