Fig. 17
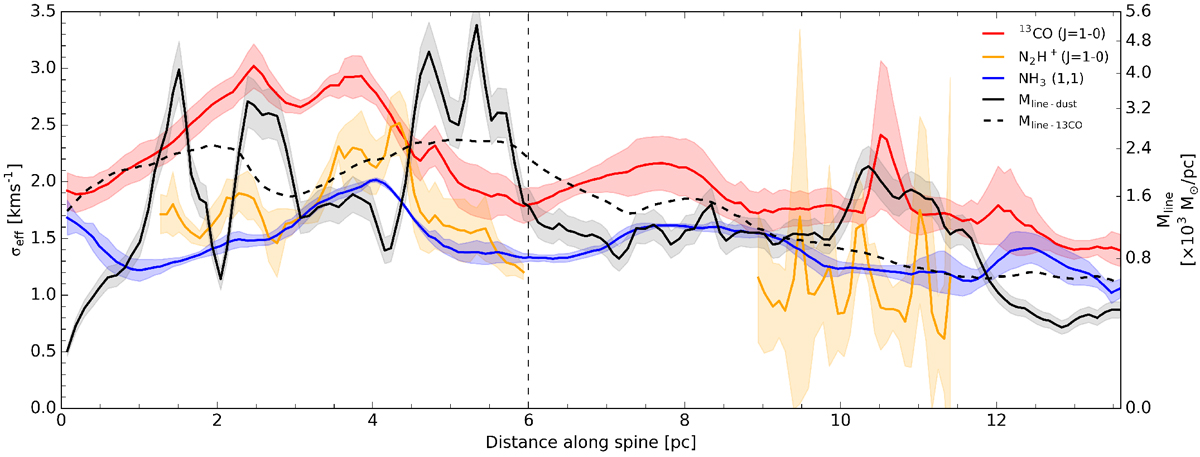
Longitudinal effective velocity dispersion and corresponding ![]() are shown using the same molecular transitions and line colours as shown in Fig. 13. Also plotted are Mline-dust and Mline-13CO (and corresponding
are shown using the same molecular transitions and line colours as shown in Fig. 13. Also plotted are Mline-dust and Mline-13CO (and corresponding ![]() ). Except for 13CO-based measurements, the values are averaged over the same width and length as in Fig. 4, whereas 13CO-based values are averaged over a 2.82 pc scale (i.e. 1.41 pc either side of the ridge). The y axis on the left portrays the velocity dispersion and the y axis on the right is the Mline. The axis appears stretched by a square root scale since, in the critical case, σeff ∝Mline0.5. Translucent regions describes the 1-sigma uncertainty values each molecular line tracer. 1-sigma uncertainty values are not shown for Mline-13CO.
). Except for 13CO-based measurements, the values are averaged over the same width and length as in Fig. 4, whereas 13CO-based values are averaged over a 2.82 pc scale (i.e. 1.41 pc either side of the ridge). The y axis on the left portrays the velocity dispersion and the y axis on the right is the Mline. The axis appears stretched by a square root scale since, in the critical case, σeff ∝Mline0.5. Translucent regions describes the 1-sigma uncertainty values each molecular line tracer. 1-sigma uncertainty values are not shown for Mline-13CO.
Current usage metrics show cumulative count of Article Views (full-text article views including HTML views, PDF and ePub downloads, according to the available data) and Abstracts Views on Vision4Press platform.
Data correspond to usage on the plateform after 2015. The current usage metrics is available 48-96 hours after online publication and is updated daily on week days.
Initial download of the metrics may take a while.