Fig. 9
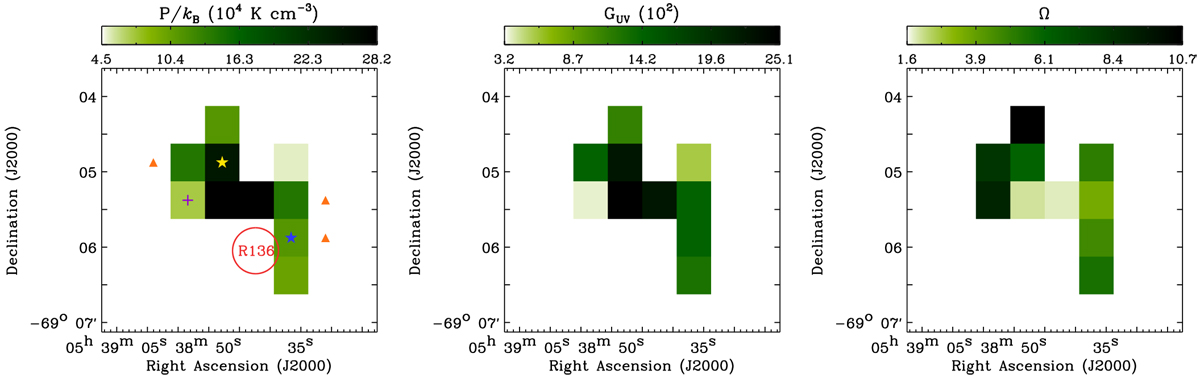
Best-fit PDR solutions (P∕kB, GUV, and Ω on the left, middle, and right). AV = 2 mag was constrained for all but one pixel, and the location of this pixel with the smaller AV = 1.5 mag is markedwith the purple cross on the left panel. The three masked pixels with unreasonably high Ω ~ 30–50 are marked with the orange triangles (Sect. 5.1.3 for details), while the pixels for Figs. 8 and 10 are indicated by the yellow and blue stars, respectively. Finally, the location of R136 is shown as the red circle.
Current usage metrics show cumulative count of Article Views (full-text article views including HTML views, PDF and ePub downloads, according to the available data) and Abstracts Views on Vision4Press platform.
Data correspond to usage on the plateform after 2015. The current usage metrics is available 48-96 hours after online publication and is updated daily on week days.
Initial download of the metrics may take a while.