Fig. 8
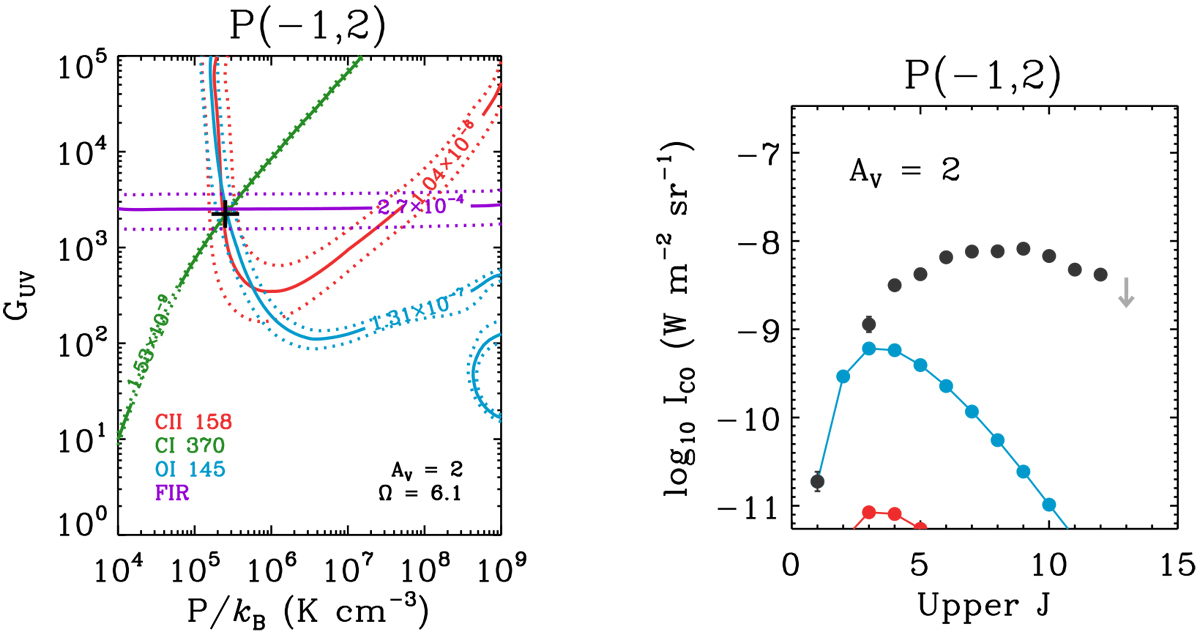
Meudon PDR modeling of the three fine-structure lines and FIR luminosity. The results presented here are for the pixel [−1, 2], which corresponds to (α, δ)J2000 = (05h38m48s, − 69°04′53″), and the location of this pixel is indicated by the yellow star in Fig. 9. On the left plot, the observed values and their 1σ uncertainties are shown as the solid and dotted lines ([C II] 158 μm, [C I] 370 μm, [O I] 145 μm, and FIR luminosity in red, green, blue, and purple). The best-fit model with the minimum χ2 value is presented as the black cross, and the constrained AV and Ω are summarized in the bottom right corner. The CO SLED predicted by the best-fit model (red; only partially shown since it is faint) is then compared with the observed CO SLED (dark and light gray for detections and nondetections) on the right plot. In addition, for an easier comparison, the predicted CO SLED is scaled up by a factor of 72 to match the observed CO(1–0) integrated intensity and shown in blue. The faint CO emission in the best-fit PDR model is further examined inSect. 5.1.4.
Current usage metrics show cumulative count of Article Views (full-text article views including HTML views, PDF and ePub downloads, according to the available data) and Abstracts Views on Vision4Press platform.
Data correspond to usage on the plateform after 2015. The current usage metrics is available 48-96 hours after online publication and is updated daily on week days.
Initial download of the metrics may take a while.