Fig. 6
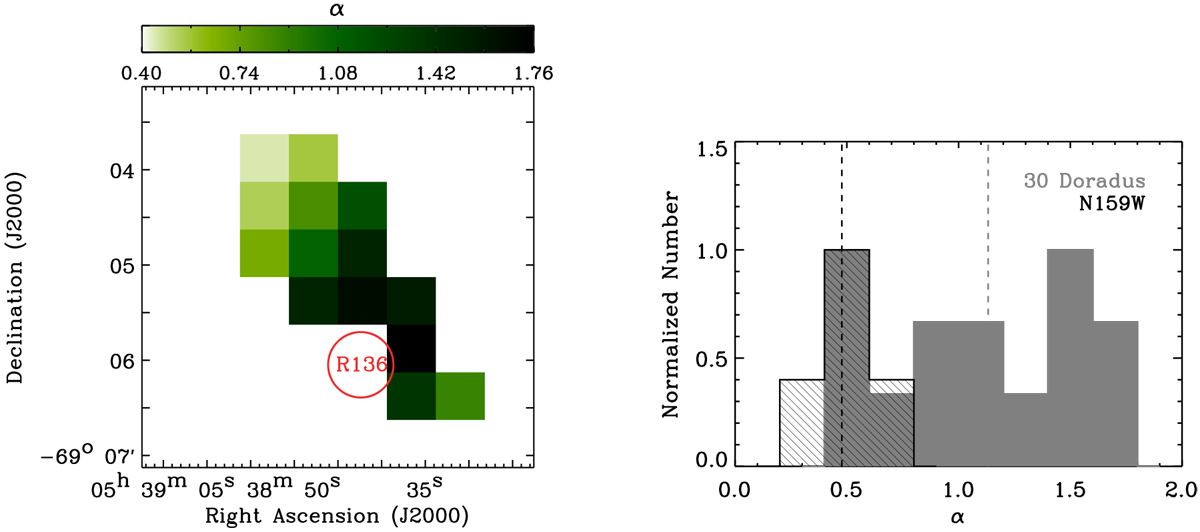
Left: high-to-intermediate-J CO ratio (α) for 30 Doradus. For the derivation of α, 25 pixels were masked since they have nondetections for the required transitions. The location of R136 is also indicated by the red circle. Right: comparison of α between 30 Doradus (gray solid histogram) and N159W (black hatched histogram). The α values of N159W were calculated by applying Eq. (1) to the data from Lee et al. (2016), and the median value of each histogram is shown as the dashed line. For both 30 Doradus and N159W, the α values are on42″ scales.
Current usage metrics show cumulative count of Article Views (full-text article views including HTML views, PDF and ePub downloads, according to the available data) and Abstracts Views on Vision4Press platform.
Data correspond to usage on the plateform after 2015. The current usage metrics is available 48-96 hours after online publication and is updated daily on week days.
Initial download of the metrics may take a while.