Fig. 5
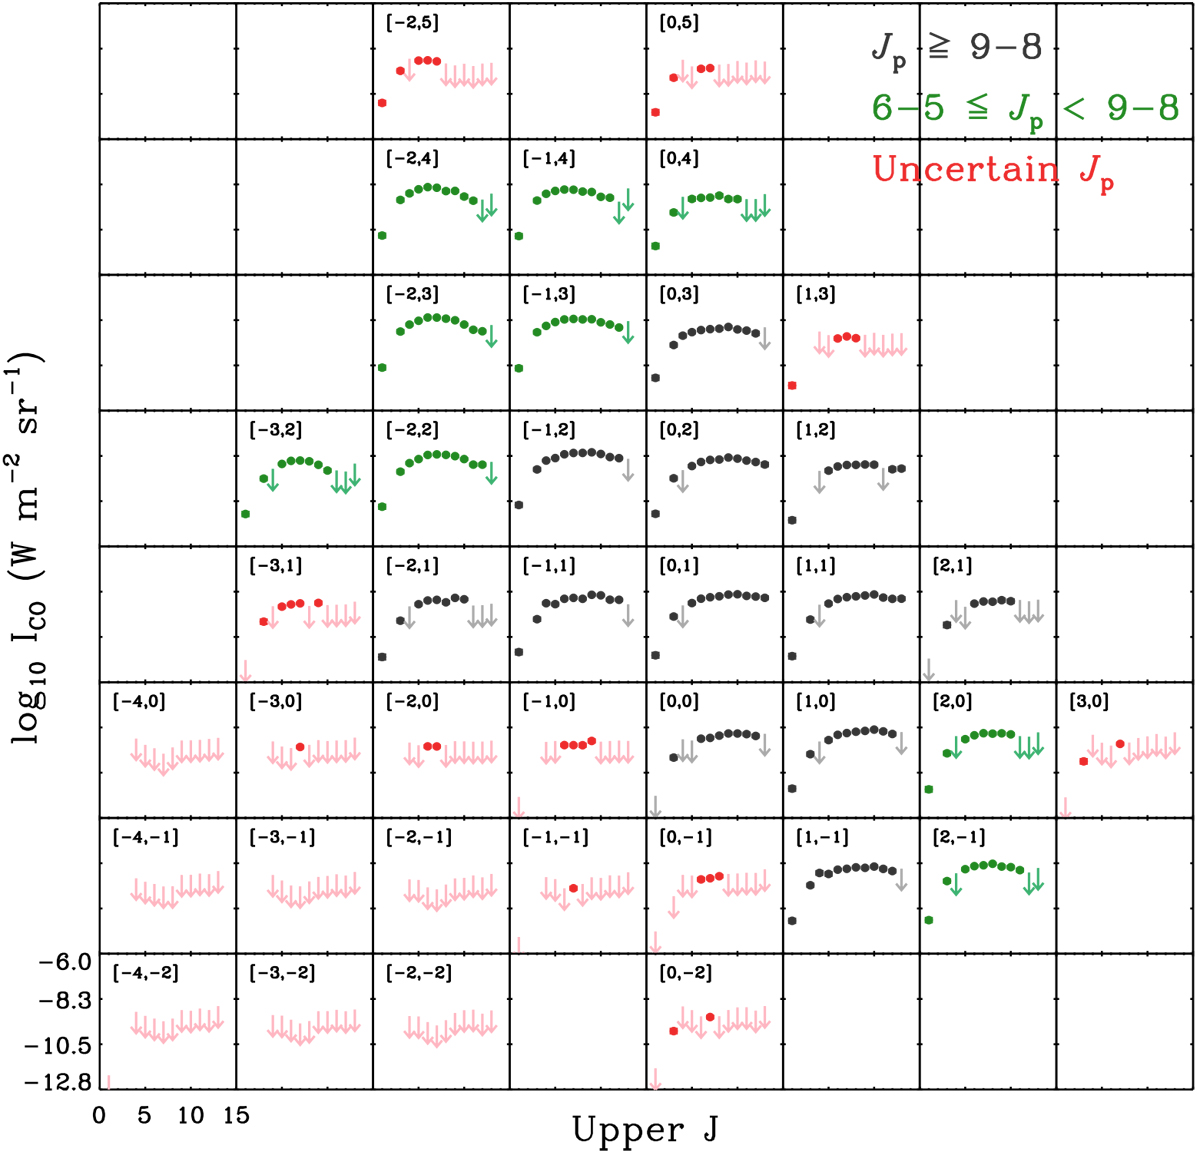
CO SLEDs of 30 Doradus. Here each CO SLED was constructed using all available CO transitions from Ju = 1 to 13 for each 30″ pixel. To indicate a location relative to the pixel that is closest to R136, a pair of numbers is shown in the top left corner of each pixel, e.g., [0,0] corresponds to (α, δ)J2000 = (05h38m42s, − 69°05′53″). In addition, the circles and error bars (too small to be visible in many cases) show the measured intensities and 1σ uncertainties for detections, while the downward arrows represent the upper limits based on S∕Ns = 5 for nondetections. Finally, the CO SLEDs are presented in different colors depending on the transition they peak (Jp): black (Jp = 9–8 or 10–9), green (6–5 ≤ Jp < 9–8), and red (uncertain Jp due to many nondetections). The nondetections are then shown in lighter shades (gray, light green, and pink) to distinguish them from the detections.
Current usage metrics show cumulative count of Article Views (full-text article views including HTML views, PDF and ePub downloads, according to the available data) and Abstracts Views on Vision4Press platform.
Data correspond to usage on the plateform after 2015. The current usage metrics is available 48-96 hours after online publication and is updated daily on week days.
Initial download of the metrics may take a while.