Fig. 3
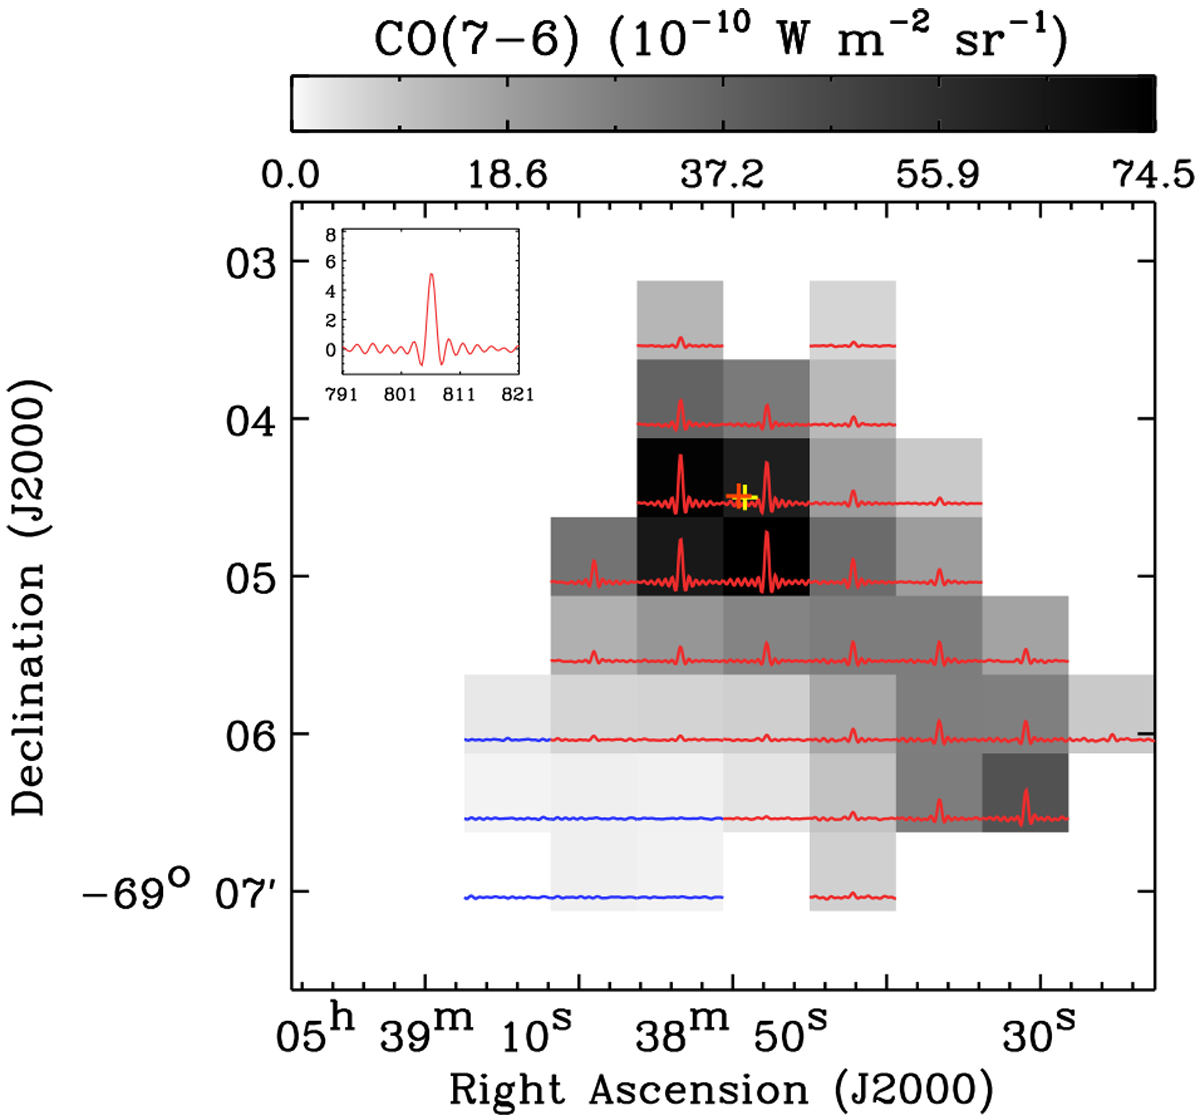
CO(7–6) integrated intensity image (FWHM = 42″; pixel size = 30″). In our FTS observations, CO(7–6) is one of the brightest and most sensitive transitions (Table 1; Sect. 4). Over the grayscale image, the spectrum of each pixel is overlaid, the x- and y-axis ranges of which (in GHz and 10−18 W m−2 Hz−1 sr−1) are indicated in the top left corner with an example spectrum. This spectrum is from the pixel that was observed with the two central detectors SLWC3 and SSWD4 (yellow and orange crosses) of the first jiggle observation of the Obs. ID = 1342219550. The spectra in red and blue represent detections and nondetections based on our threshold of statistical signal-to-noise ratio (S∕Ns) = 5 (Sect. 4.1).
Current usage metrics show cumulative count of Article Views (full-text article views including HTML views, PDF and ePub downloads, according to the available data) and Abstracts Views on Vision4Press platform.
Data correspond to usage on the plateform after 2015. The current usage metrics is available 48-96 hours after online publication and is updated daily on week days.
Initial download of the metrics may take a while.