Fig. 2
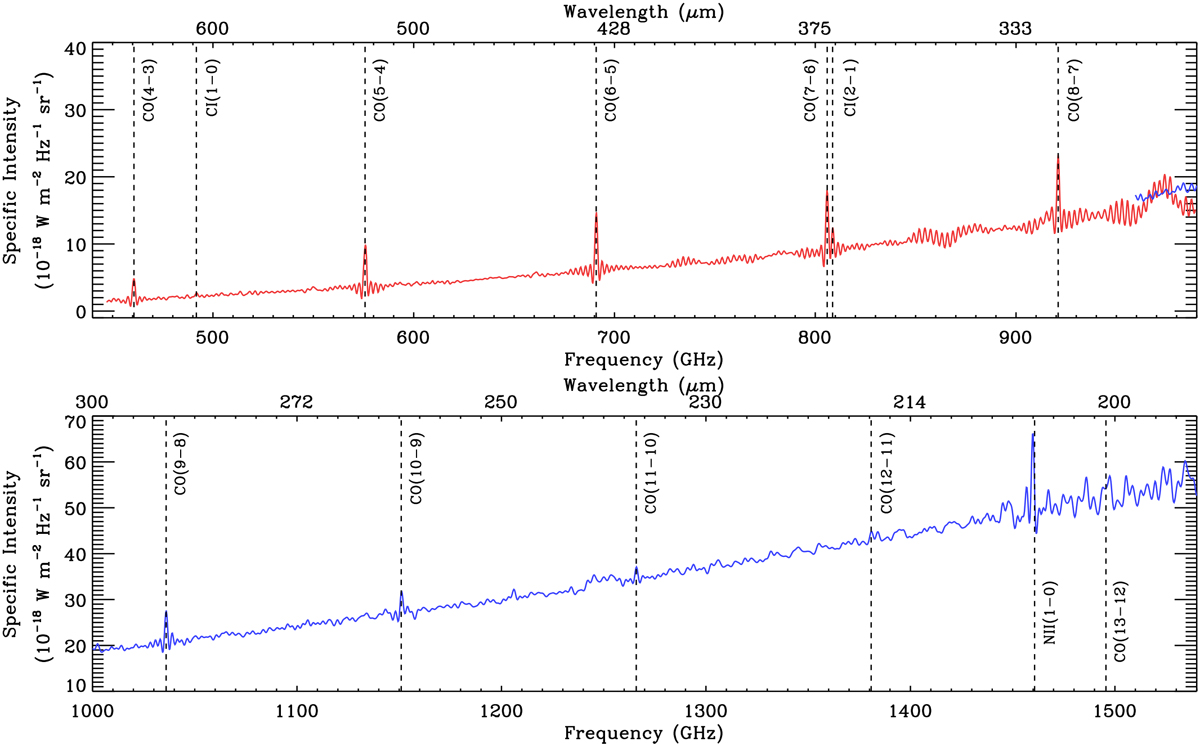
Point-source calibrated spectra from two central detectors, SLWC3 (red) and SSWD4 (blue). These spectra are from the first jiggle position of the Obs. ID = 1342219550, and the locations of the two detectors are shown as the yellow and orange crosses in Fig. 3. Additionally, the spectral lines observed with the SPIRE FTS are indicated by the blackdashed lines. We note that no further data processing (e.g., baseline subtraction and smoothing) was done for the spectral lines here, which are at their original angular resolutions (e.g., Table 1).
Current usage metrics show cumulative count of Article Views (full-text article views including HTML views, PDF and ePub downloads, according to the available data) and Abstracts Views on Vision4Press platform.
Data correspond to usage on the plateform after 2015. The current usage metrics is available 48-96 hours after online publication and is updated daily on week days.
Initial download of the metrics may take a while.