Fig. 18
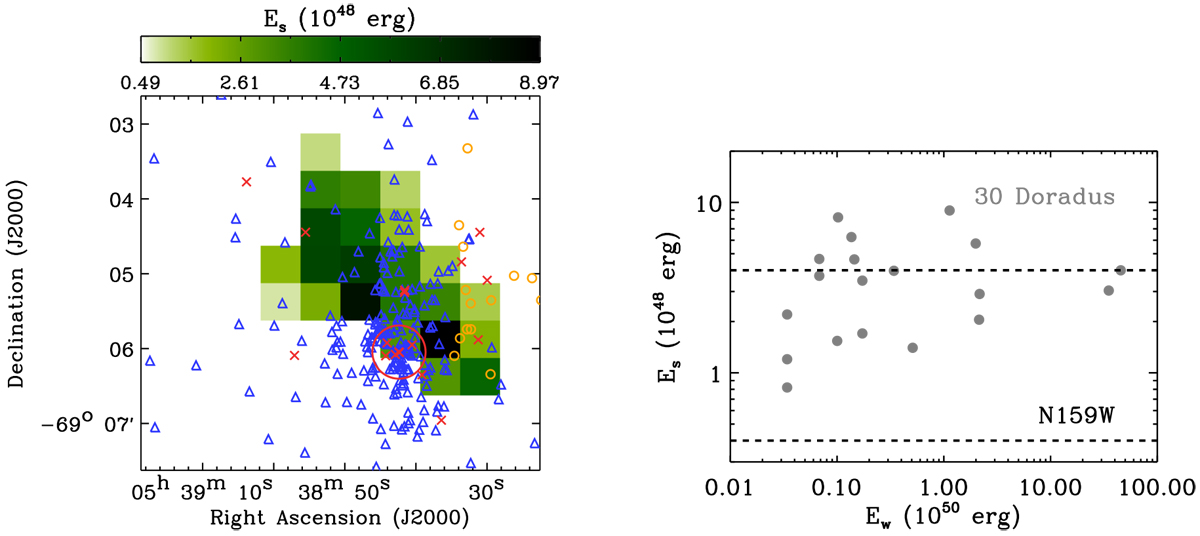
Left:Es of the final shock models (shown in Fig. 14) is presented along with ~500 stars for which Ew estimates are available (Ew ≥ 1050 erg as the red crosses, 1049 erg ≤ Ew < 1050 erg as the orange circles, and Es < 1049 erg as the blue triangles; Doran et al. 2013). The location of R136 is also indicated by the red circle. Right: Es as a functionof Ew. The data points for 30 Doradus are shown in gray, while the range of Es estimated by Lee et al. (2016) for N159W is overlaid as the black dashed line.
Current usage metrics show cumulative count of Article Views (full-text article views including HTML views, PDF and ePub downloads, according to the available data) and Abstracts Views on Vision4Press platform.
Data correspond to usage on the plateform after 2015. The current usage metrics is available 48-96 hours after online publication and is updated daily on week days.
Initial download of the metrics may take a while.