Fig. 17
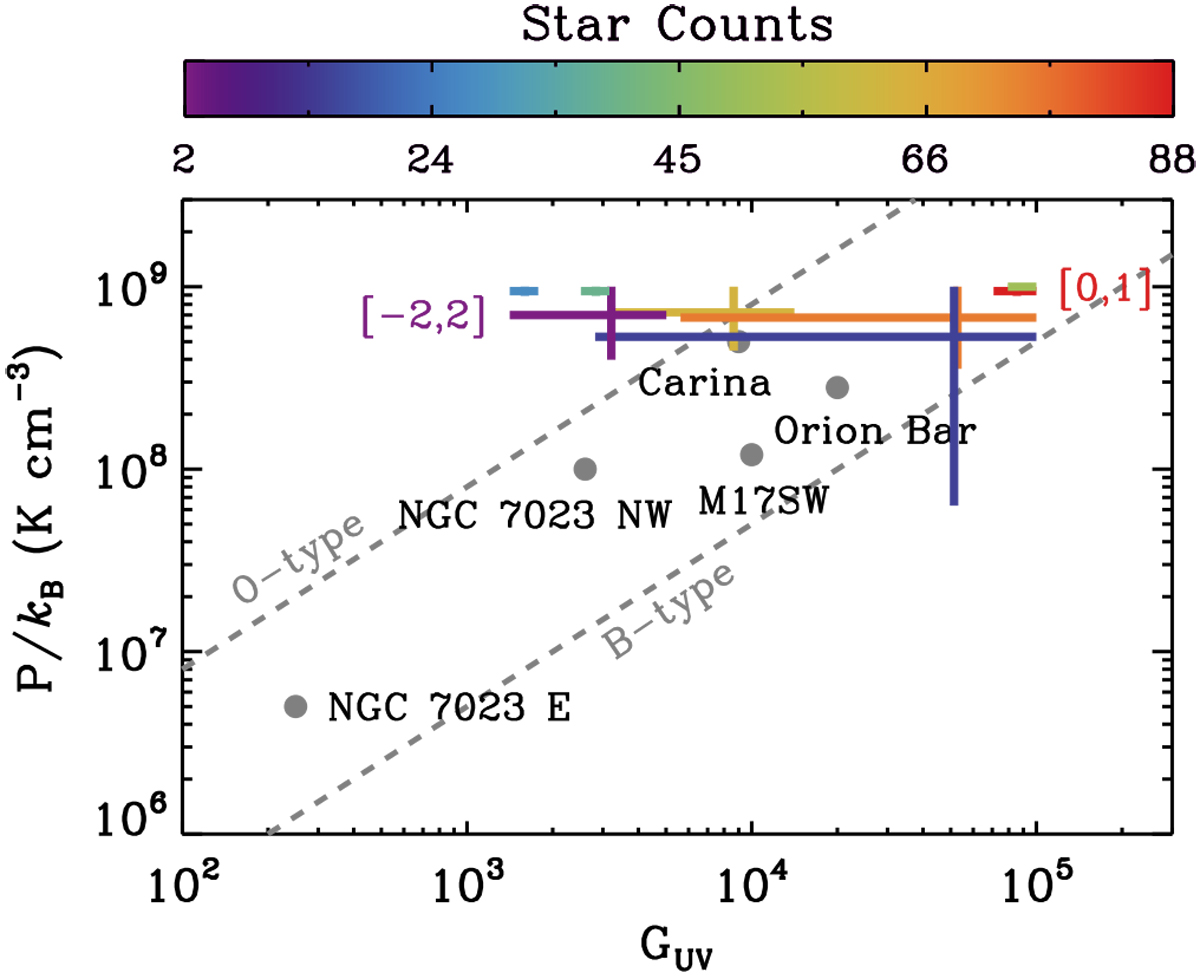
P∕kB as a functionof GUV for various Galactic and extragalactic sources. The high-P PDR conditions for CO emission in 30 Doradus are presented as the bars (same as in Fig 12) in different colors depending on star counts, while other sources are shown as the gray circles (Orion Bar and NGC 7023 NW from Joblin et al. 2018; Carina Nebula from Wu et al. 2018; NGC 7023 E from Köhler et al. 2014;M17SW from Pérez-Beaupuits et al. 2010). In addition, the two pixels we discuss in the main text, [−2,2] and [0,1], are indicated, along with the predictions from Bron et al. (2018) for B- and O-type stars (gray dashed lines; P∕kB -to-GUV ratio = 5 × 10³ and 8 × 10⁴ respectively).
Current usage metrics show cumulative count of Article Views (full-text article views including HTML views, PDF and ePub downloads, according to the available data) and Abstracts Views on Vision4Press platform.
Data correspond to usage on the plateform after 2015. The current usage metrics is available 48-96 hours after online publication and is updated daily on week days.
Initial download of the metrics may take a while.