Fig. 15
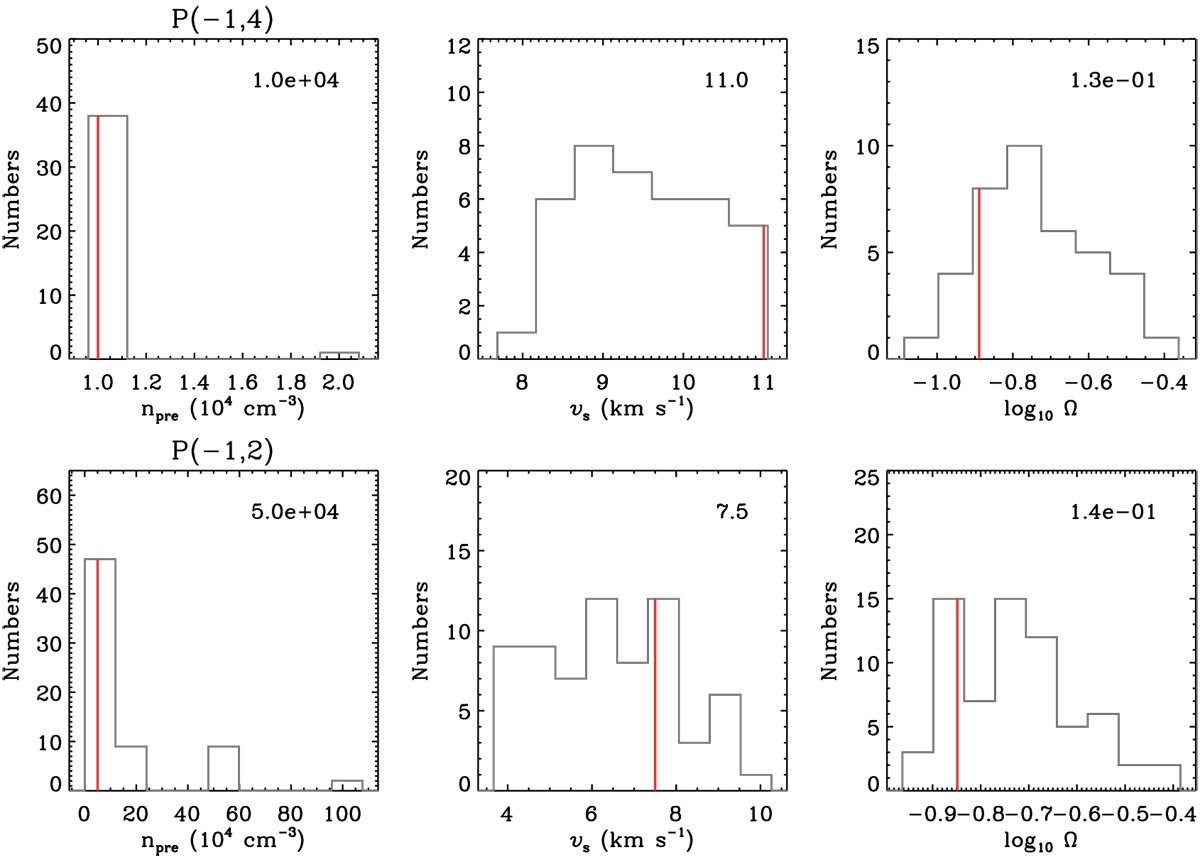
Another illustration of the degeneracy in our shock modeling. The gray histograms show the selected shock models for two pixels [−1, 4] and [−1, 2] that reproduce our CO and H2 0–0 S(3) observations within a factor of two (top and bottom; number of the selected models = 39 and 67, respectively). For each histogram, the final shock parameter we constrained in Sect. 5.3.3 is shown as the red solid line and summarized in the top right corner. A comparison between the top and bottom histograms clearly shows that [−1, 4] has a relatively narrow distribution of npre.
Current usage metrics show cumulative count of Article Views (full-text article views including HTML views, PDF and ePub downloads, according to the available data) and Abstracts Views on Vision4Press platform.
Data correspond to usage on the plateform after 2015. The current usage metrics is available 48-96 hours after online publication and is updated daily on week days.
Initial download of the metrics may take a while.