Fig. 14
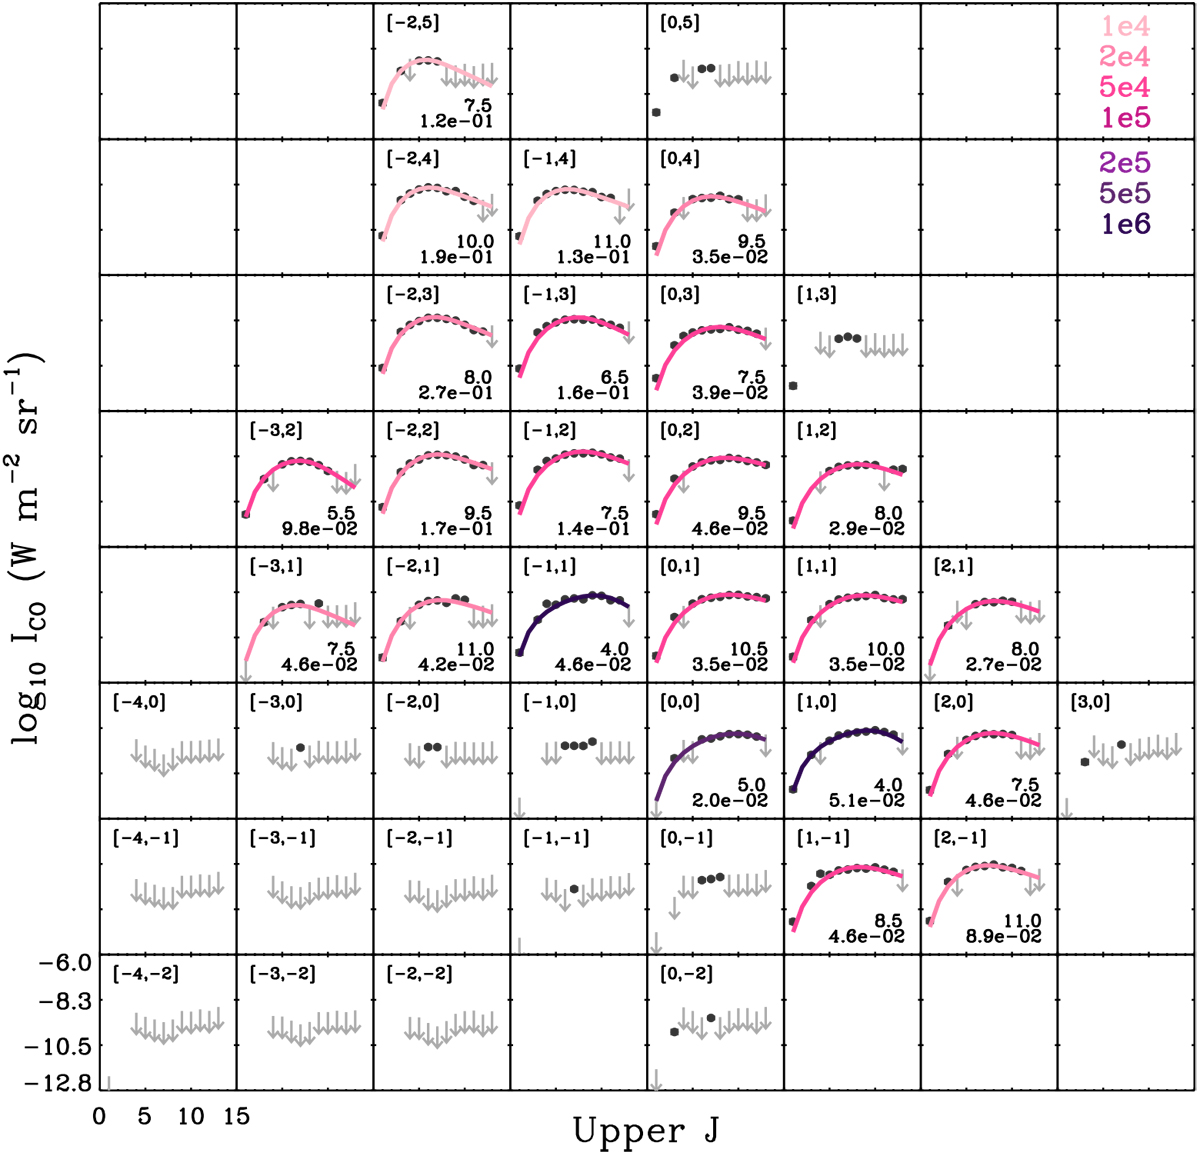
Constrained shock models overlaid with the observed CO SLEDs. As in Fig. 5, the circles and downward arrows represent the measured intensities and 5σs -based upper limits. A location with respect to the pixel that is closest to R136 is also indicated as a pair of numbers in the top left corner of each pixel (e.g., [0,0] corresponds to (α, δ)J2000 = (05h38m42s, − 69°05′53″), and each pixel covers 30″). The shock models with different npre are presented in different colors (darker shades for higher npre), and the exact npre values (in cm−3) are summarized in the top right corner of this figure. Finally, the constrained shock velocities (in km s−1) and beam filling factors (unitless) are shown in the bottom right corner of each pixel.
Current usage metrics show cumulative count of Article Views (full-text article views including HTML views, PDF and ePub downloads, according to the available data) and Abstracts Views on Vision4Press platform.
Data correspond to usage on the plateform after 2015. The current usage metrics is available 48-96 hours after online publication and is updated daily on week days.
Initial download of the metrics may take a while.