Fig. 13
Degeneracy in npre
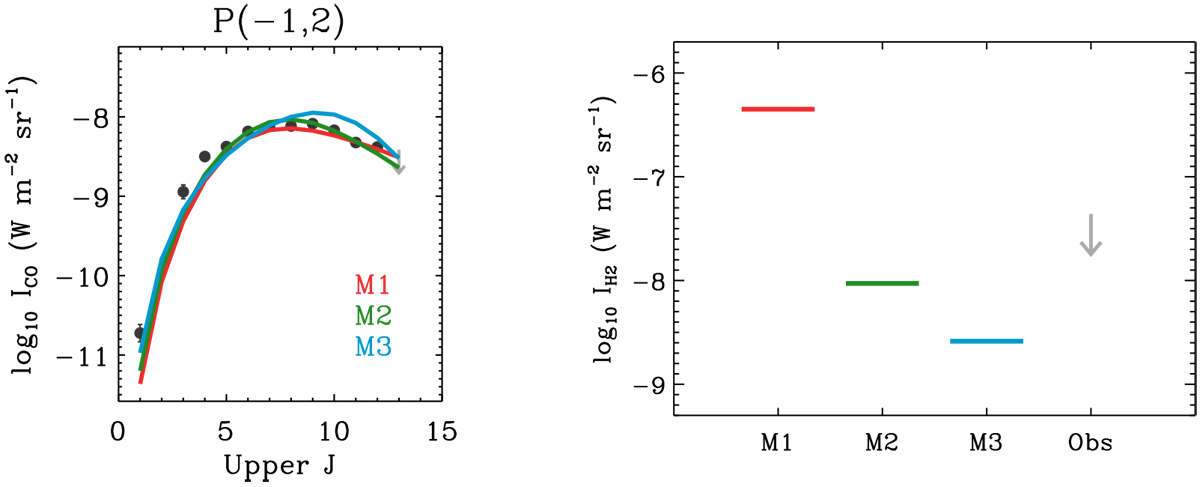
and vs. To illustrate this issue, the observed CO and H2
0–0 S(3) transitions of the pixel [−1, 2] are shown in the left and right plots along with three different shock models (“M1”
in red: npre = 104
cm−3 and vs = 28 km s−1;
“M2”
in green: npre = 5 × 10⁴
cm−3 and vs = 7.5 km s−1;
“M3”
in blue: npre = 106
cm−3 and vs = 4 km s−1). For both plots, dark and light gray colors are used to represent detections and nondetections, and
![]() = 0 and Ω
~ 0.1 are adopted for the three shock models.
= 0 and Ω
~ 0.1 are adopted for the three shock models.
Current usage metrics show cumulative count of Article Views (full-text article views including HTML views, PDF and ePub downloads, according to the available data) and Abstracts Views on Vision4Press platform.
Data correspond to usage on the plateform after 2015. The current usage metrics is available 48-96 hours after online publication and is updated daily on week days.
Initial download of the metrics may take a while.