Fig. 12
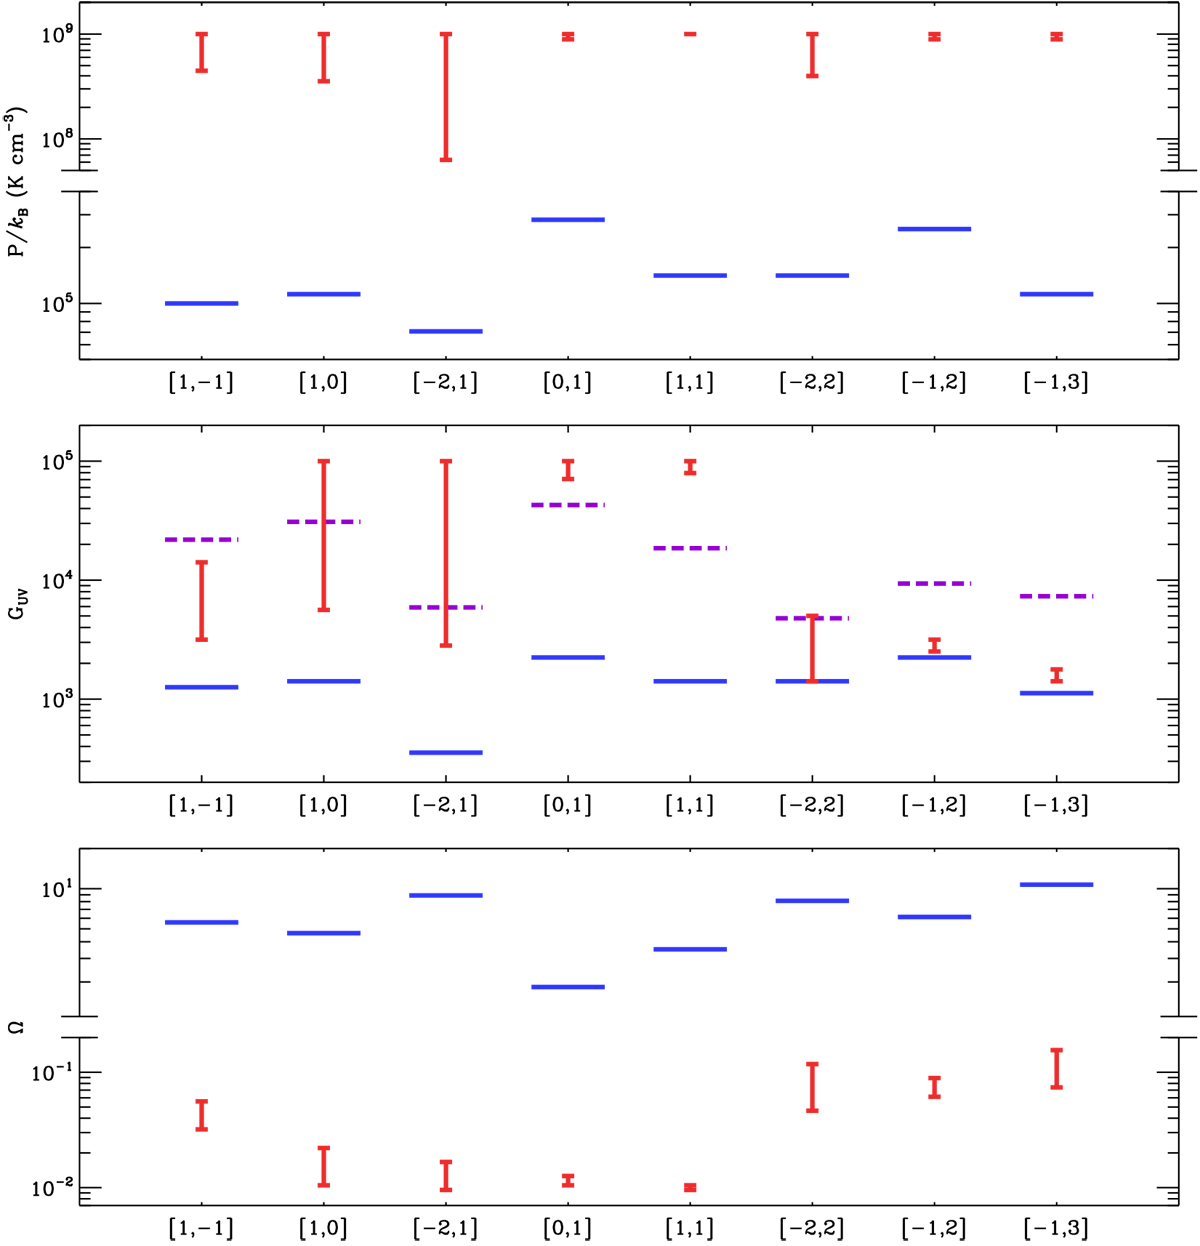
Comparison between the low- and high-P PDR models(P∕kB, GUV, and Ω on the top, middle, and bottom panels). In each plot, the low-P models we constrained using the fine-structure lines and FIR luminosity (Sect. 5.1.3) are indicated by the blue solid lines, while the high-P models for the CO lines are presented as the red bars (ranging from the minimum to maximum values). In the GUV plot, Gstars in Fig. 7 is also shown as the purple dashed lines. In total, eight pixels where we found reasonably good high-P models are shown in each plot, and the location of each pixel can be inferred from Figs. 3 and 5. Finally, we note that the P and Ω plots have broken y-axes to show a wide range of the data.
Current usage metrics show cumulative count of Article Views (full-text article views including HTML views, PDF and ePub downloads, according to the available data) and Abstracts Views on Vision4Press platform.
Data correspond to usage on the plateform after 2015. The current usage metrics is available 48-96 hours after online publication and is updated daily on week days.
Initial download of the metrics may take a while.