Fig. 11
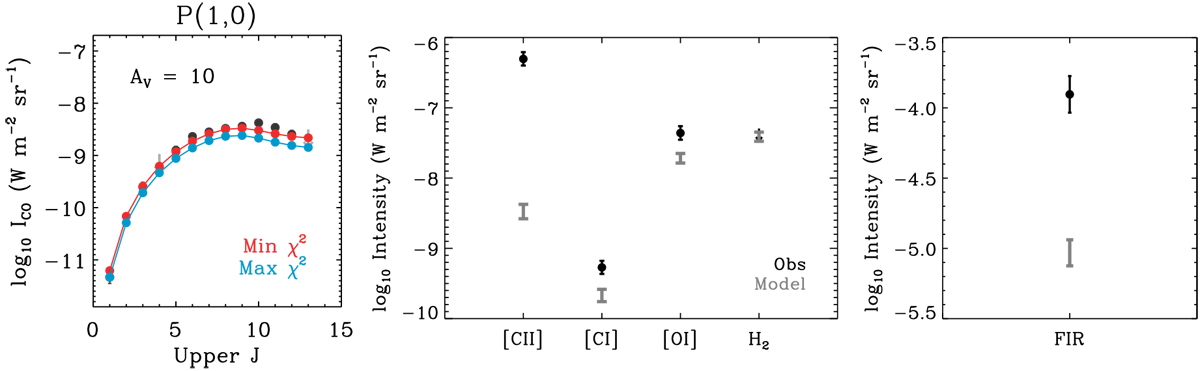
Comparison between the observations and the predictions from the PDR models in Fig. 10. In the left plot, the observed CO SLED (dark and light gray for detections and nondetections) is compared with the predictions from two models (those resulting in minimum and maximum χ2 values with respect to the observed CO lines are presented in red and blue). In the middle and right plots, the observed [C II] 158 μm, [C I] 370 μm, [O I] 145 μm, H2 0–0 S(3), and FIR luminosity are shown (black) along with the ranges of the model predictions (from minimum to maximum values; gray).
Current usage metrics show cumulative count of Article Views (full-text article views including HTML views, PDF and ePub downloads, according to the available data) and Abstracts Views on Vision4Press platform.
Data correspond to usage on the plateform after 2015. The current usage metrics is available 48-96 hours after online publication and is updated daily on week days.
Initial download of the metrics may take a while.