Fig. 1
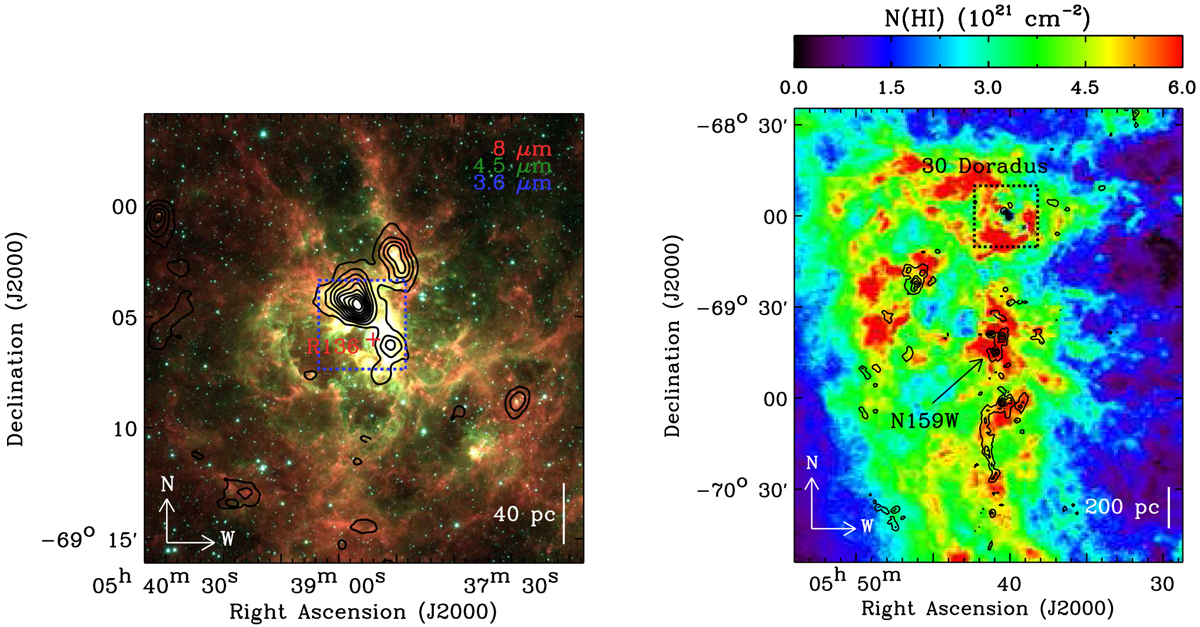
Left: three-color composite image of 30 Doradus (Spitzer 3.6, 4.5, and 8 μm in blue, green, and red; Meixner et al. 2006). The central star cluster R136 is marked with the red cross, and the FTS coverage is outlined in blue. Additionally, the CO(1–0) integrated intensity from the MAGMA survey (Wong et al. 2011; Sect. 3.4) is overlaid as the black contours with levels ranging from 10 to 90% of the peak (16.6 K km s−1) in steps of 10%. Right: H I column density image from Kim et al. (1998). The MAGMA CO(1–0) integrated intensity is shown as the black contours (10 to 90% of the peak value, 39.5 K km s−1, in steps of 20%), and the coverage of the left image is indicated by the black dashed box. This large H I structure, where 30 Doradus and N159W are located, corresponds to the southeastern H I overdensity region of the LMC (e.g., D’Onghia & Fox 2016).
Current usage metrics show cumulative count of Article Views (full-text article views including HTML views, PDF and ePub downloads, according to the available data) and Abstracts Views on Vision4Press platform.
Data correspond to usage on the plateform after 2015. The current usage metrics is available 48-96 hours after online publication and is updated daily on week days.
Initial download of the metrics may take a while.