Fig. 10
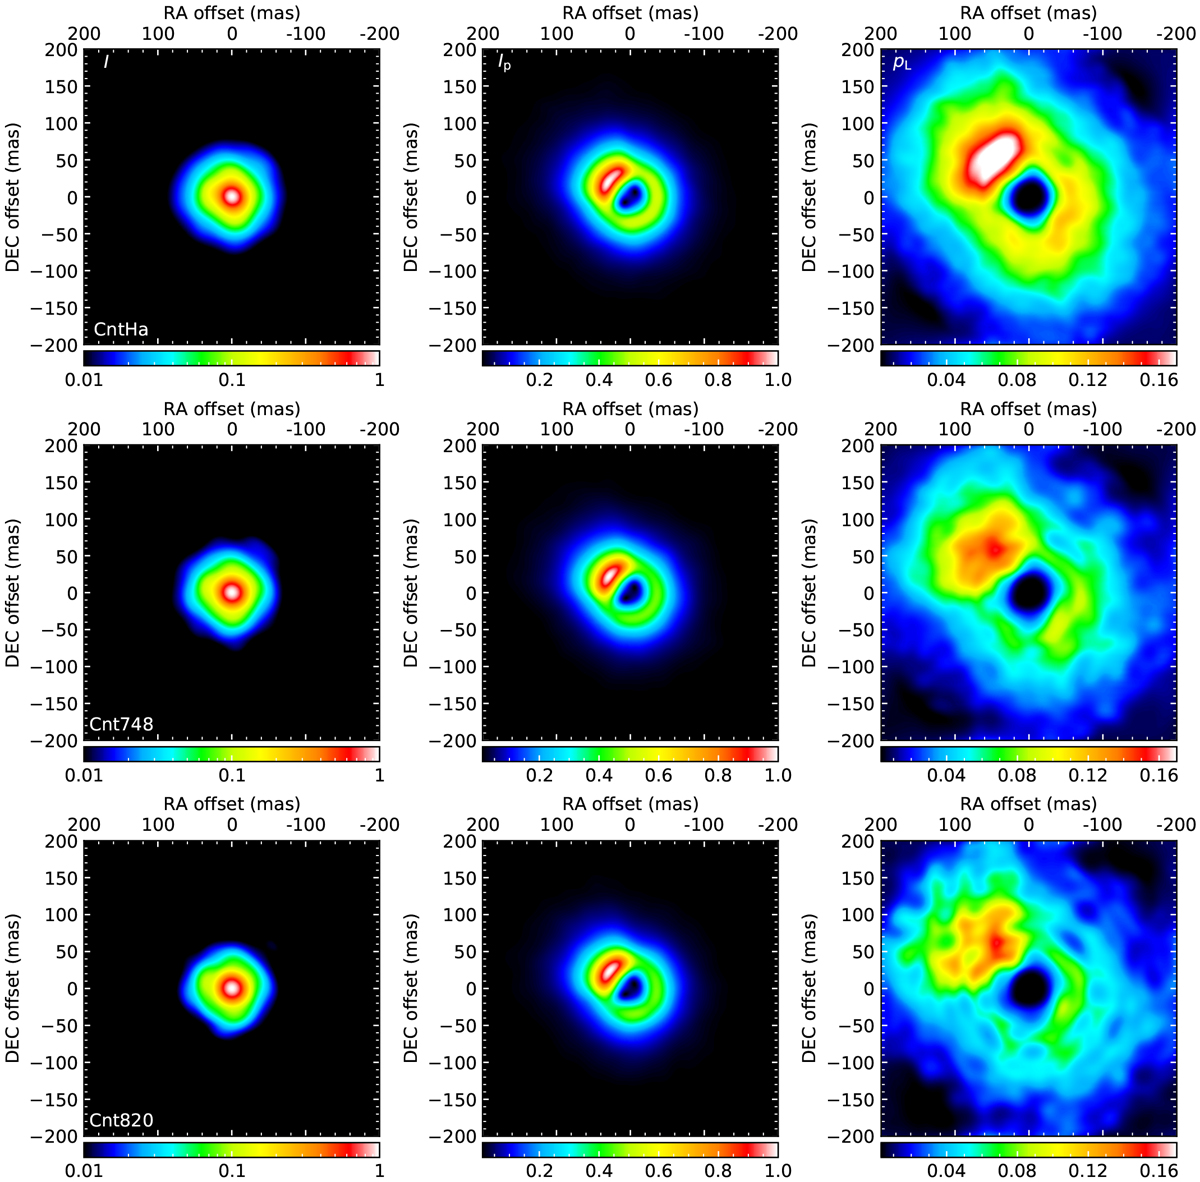
Best-fit dust clump model for IK Tau. From left to right: maps of the intensity I, polarized intensity Ip, and degree of linear polarization pL predicted by the model after convolution with the observed PSF. The model images predicted at 645, 748, and 820 nm are presented in the columns from top to bottom, respectively. North is to the top, east to the left.
Current usage metrics show cumulative count of Article Views (full-text article views including HTML views, PDF and ePub downloads, according to the available data) and Abstracts Views on Vision4Press platform.
Data correspond to usage on the plateform after 2015. The current usage metrics is available 48-96 hours after online publication and is updated daily on week days.
Initial download of the metrics may take a while.