Fig. A.2.
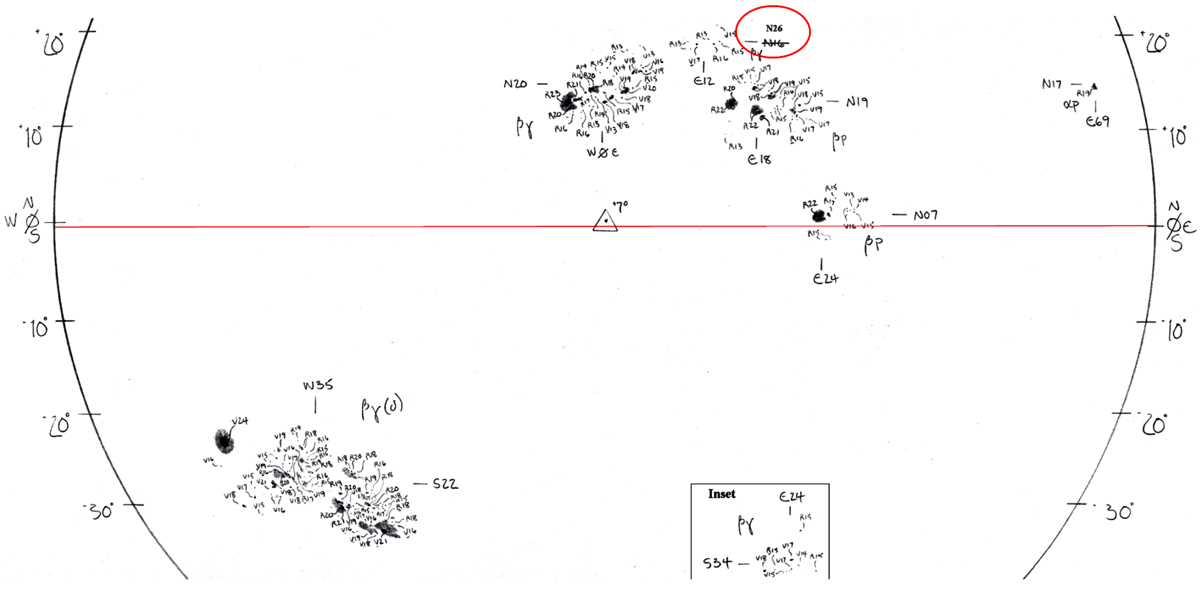
Example of drawing taken on 29 August 1999 showing high degree of detail. The scanned image excludes portion of the drawing with information about date and time of observations. The red line shows the horizontal direction in image orientation. Comparing the location of end points, it is clear that there is a slight misalignment between the horizontal direction and east-west orientation. Portion of the image enclosed by box is an inset, which shows portion of solar image not in its correct location on solar disk. The red oval indicates an example of an error in the heliographic coordinates of an active region. In this particular case, the later correction of latitude of this region is in error; compare the number with the approximate latitudes indicated on the solar limbs.
Current usage metrics show cumulative count of Article Views (full-text article views including HTML views, PDF and ePub downloads, according to the available data) and Abstracts Views on Vision4Press platform.
Data correspond to usage on the plateform after 2015. The current usage metrics is available 48-96 hours after online publication and is updated daily on week days.
Initial download of the metrics may take a while.