Fig. 6.
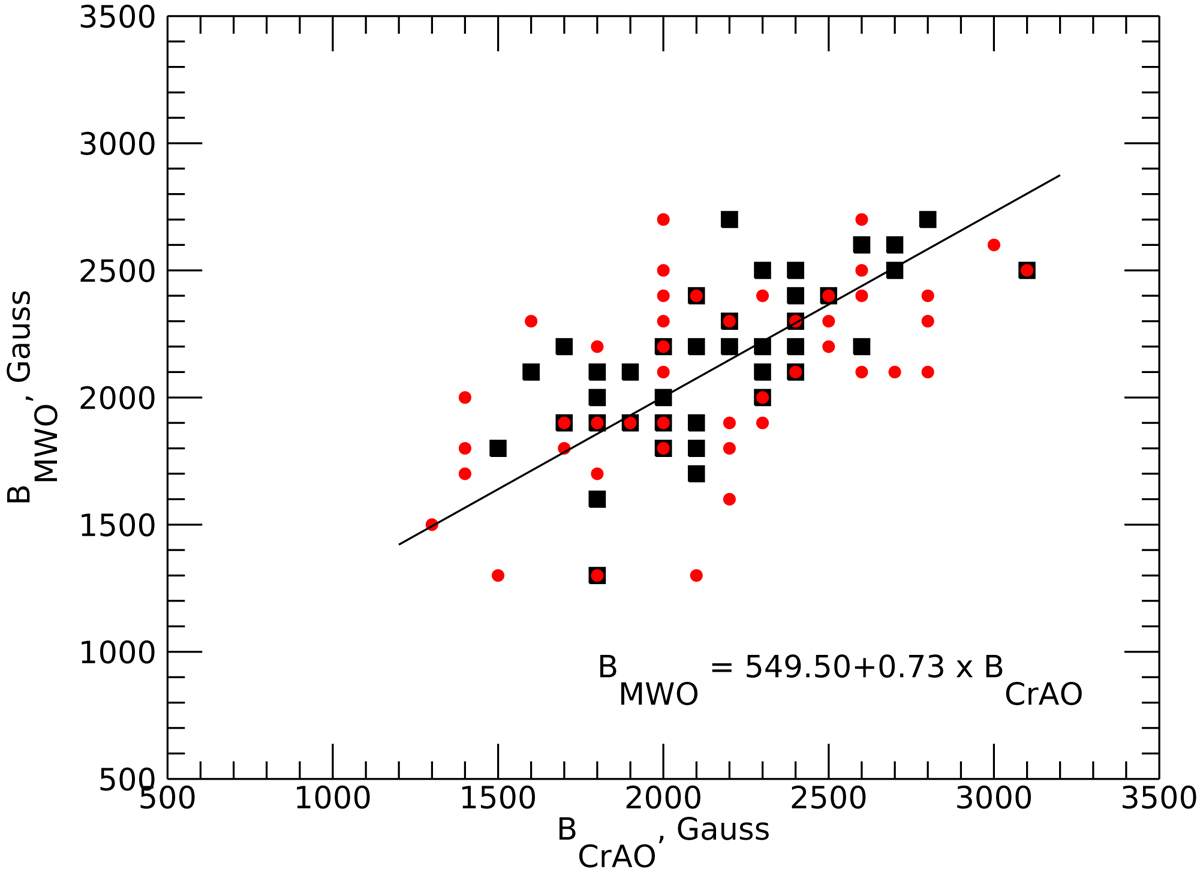
Comparison of same-day measurements of field strengths of 100 sunspots observed at MWO and CrAO. Observations from 1994 to 2003 are shown by black squares, and data for 2004–2014 are shown as filled red circles. The solid line indicates the least-squares fit by the first degree polynomial with errors in both MWO and CrAO data. The coefficients of best-fit line for all data are shown in low-right side of the figure.
Current usage metrics show cumulative count of Article Views (full-text article views including HTML views, PDF and ePub downloads, according to the available data) and Abstracts Views on Vision4Press platform.
Data correspond to usage on the plateform after 2015. The current usage metrics is available 48-96 hours after online publication and is updated daily on week days.
Initial download of the metrics may take a while.