Fig. 2.
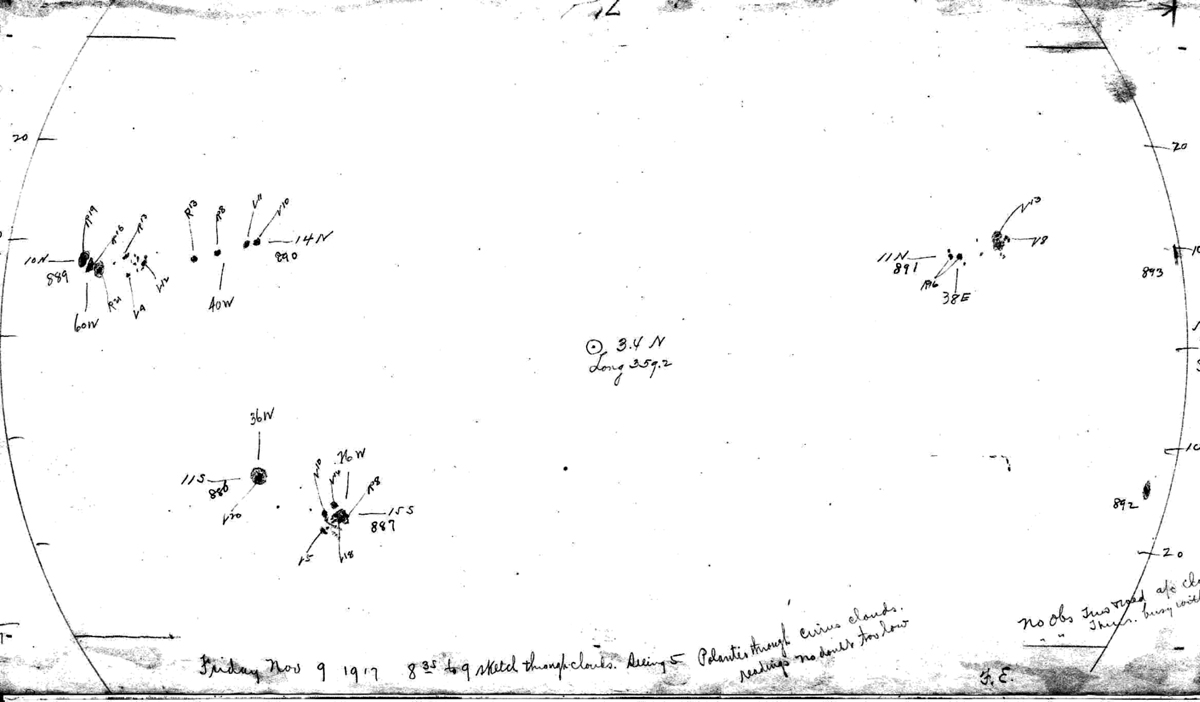
Example of a typical sunspot drawing from the MWO dataset taken on 9 November 1917 between 8:35 and 9:00 (local time). Measured sunspot field strengths are shown in units of hundred G and their polarities designated as “R” and “V” (for red and violet, which corresponds to the positive and the negative polarities). Credit: Carnegie Observatories.
Current usage metrics show cumulative count of Article Views (full-text article views including HTML views, PDF and ePub downloads, according to the available data) and Abstracts Views on Vision4Press platform.
Data correspond to usage on the plateform after 2015. The current usage metrics is available 48-96 hours after online publication and is updated daily on week days.
Initial download of the metrics may take a while.