Fig. 1.
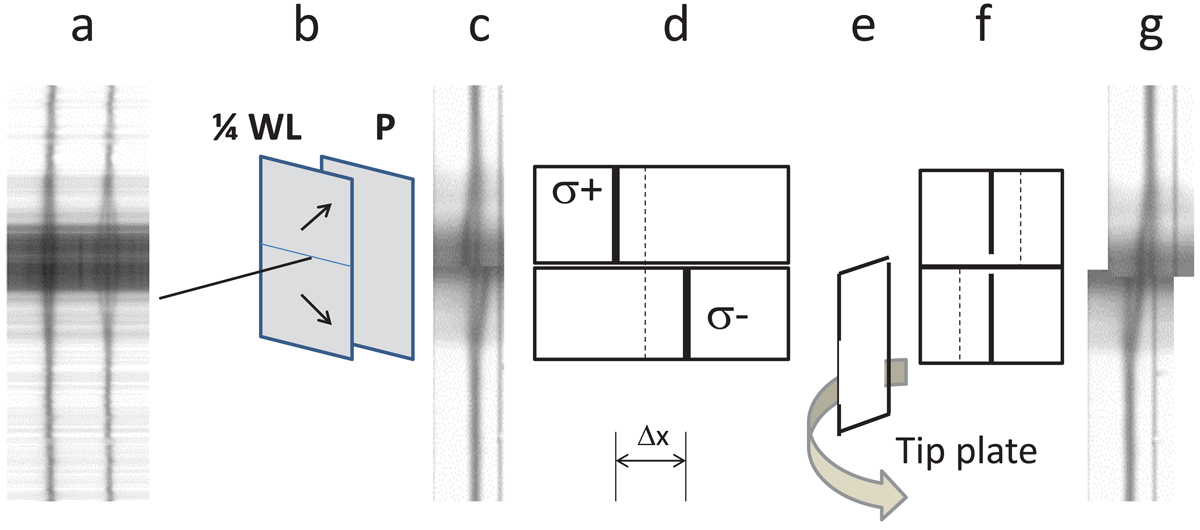
Principle of measuring the field strength in sunspots. Panel a: example of Zeeman splitting of spectral lines Fe I 6301.5 Å (left) and Fe I 6302.5 Å (right) as observed by the spectropolarimeter on board the Hinode spacecraft. The horizontal direction corresponds to the wavelength space and the vertical direction shows spatial dimension (along the spectrograph slit; in this example, across a small sunspot). The dark diffuse horizontal band in the middle of the spectra corresponds to sunspot umbra, and two gray bands above and below this dark band are sunspot penumbra. Brighter areas farther outward from the penumbra correspond to the photosphere. There, the brighter and darker horizontal lines in panel a correspond to the granulation pattern as the spectrograph slit crosses (brighter) centers of granules and (darker) intergranular spaces. Owing to the atmospheric seeing, the granulation pattern is less visible in spectra taken with VSM/SOLIS (panels c and g). To measure the magnetic field, two Zeeman components with left- and right-hand polarization are spatially separated with the two strips of optical retarder (quarter- wavelength plate, 1/4 WL) and a polarizer (P). Upper and lower strips of retarder are oriented orthogonal to each other and at 45° to the polarizer, as shown in panel b. Each strip (retarder and polarizer) transmits only one of two Zeeman components, which allows the left-hand and right-hand polarized components been separated in the vertical direction (panel c). Panel d is a simplified, schematic representation of panel c (central π component is shown as a dashed line). The value Δx is a distance between two σ components, which needs to be measured to determine the field strength. By rotating a tip plate (panel e), the observer brings two oppositely polarized components in line with each other (panels f and g), and the tip angle is used to derive the field strength.
Current usage metrics show cumulative count of Article Views (full-text article views including HTML views, PDF and ePub downloads, according to the available data) and Abstracts Views on Vision4Press platform.
Data correspond to usage on the plateform after 2015. The current usage metrics is available 48-96 hours after online publication and is updated daily on week days.
Initial download of the metrics may take a while.