Fig. 2
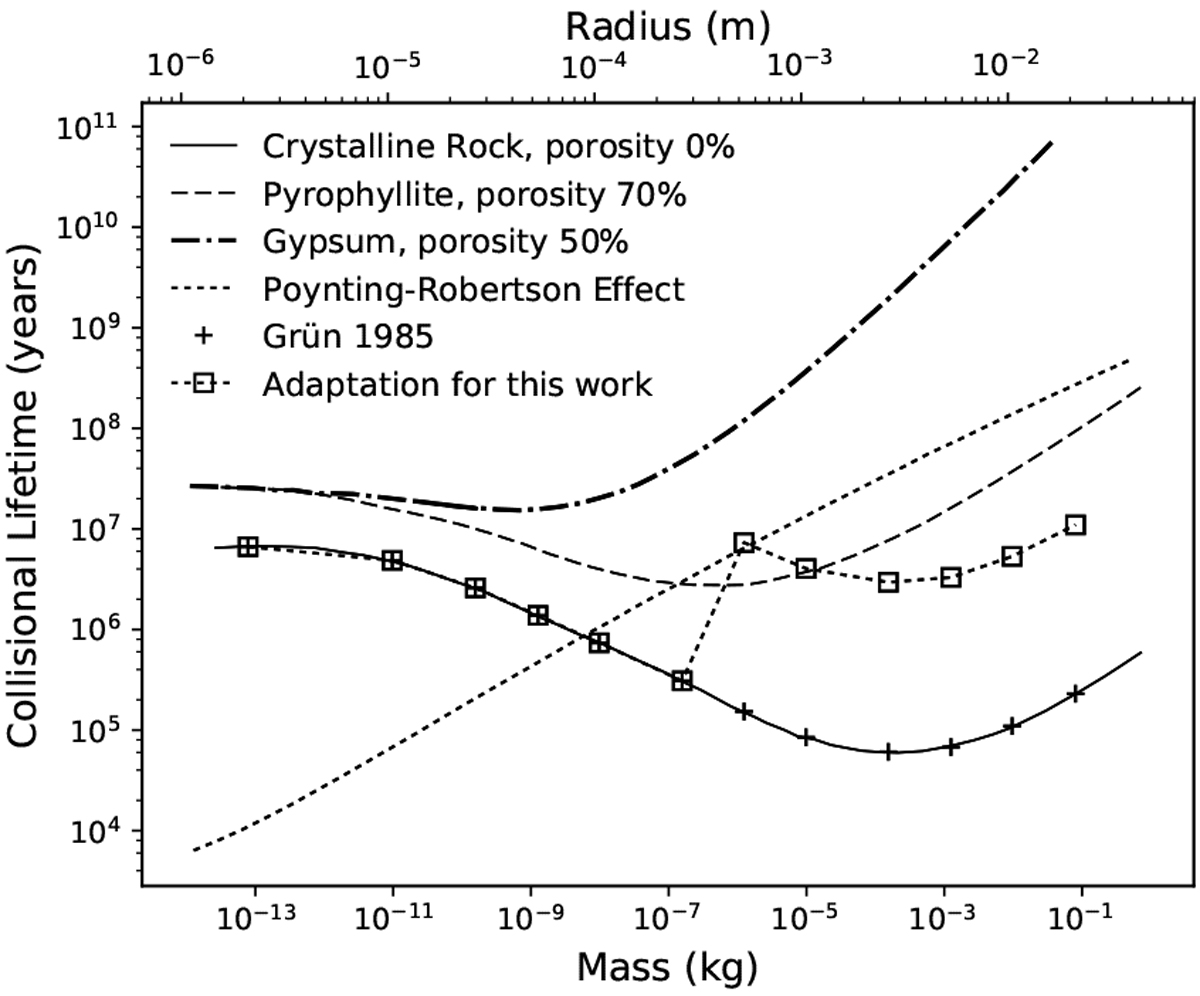
Comparison of collisional lifetimes for different materials and porosities. The solid line represents the original Grün et al. (1985) lifetimes: crosses demonstrate the particle sizes used in this model. The squares provide these collisional lifetimes when multiplied by the Fcoll given in Table 1, which varies with particle size. This is compared to recalculations of the collisional lifetimes using the method of Grün et al. (1985), but using the experimental results of Nakamura et al. (2015), which demonstrate how they are variable with particle material and porosity (dashed and dot-dashed lines). Finally, the Poynting-Robertson lifetimes (dotted line) demonstrate how the dominance of Poynting-Roberston drag or collisional shattering isdependent on particle composition and structure.
Current usage metrics show cumulative count of Article Views (full-text article views including HTML views, PDF and ePub downloads, according to the available data) and Abstracts Views on Vision4Press platform.
Data correspond to usage on the plateform after 2015. The current usage metrics is available 48-96 hours after online publication and is updated daily on week days.
Initial download of the metrics may take a while.