Fig. 3
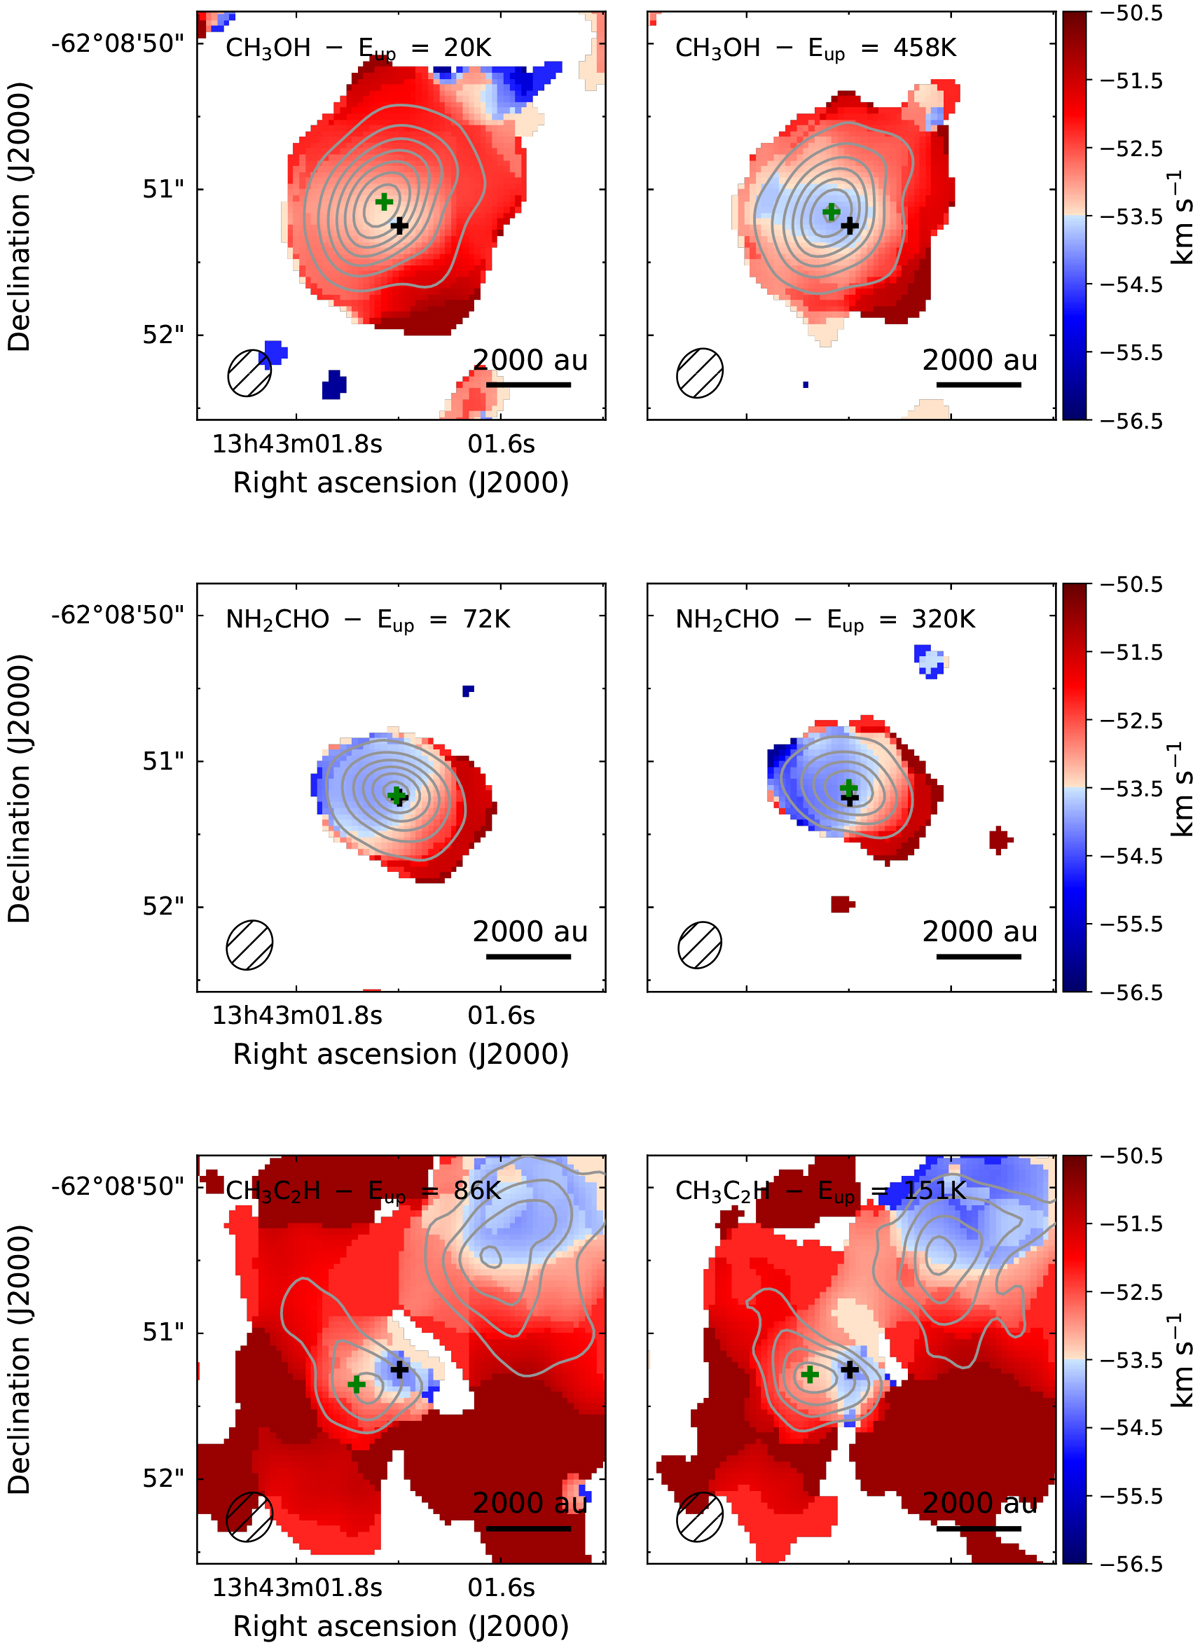
First-moment (intensity-weighted velocity) map of CH3OH (top panels) lines at 254.0153 GHz (left) and 241.2679 GHz (right). Pixels with S/Ns of less than three are masked out. The zero-moment (integrated intensity) map for each line is overlaid in grey contours. Contours start at 9σ and are in steps of 12σ, with σ = 1.34 × 10⁻² and 7.16 × 10⁻³ Jy beam−1 km s−1, for the left and right panel, respectively. The black and green crosses mark the locations of the peak continuum emission and peak integrated line intensity, respectively. Middle panel: same as top panels but for NH2 CHO lines at 239.952 GHz (left) and 254.727 GHz (right). Contours start at 9σ and are in steps of 12σ, with σ = 6.17 × 10⁻³ and 6.25 × 10⁻³ Jy beam−1 km s−1, for the left and right panel, respectively. Bottom panels: same as top panels but for CH3 C2H lines at 239.2523 GHz (left) and 239.2112 GHz (right). Contours start at 6σ and are in steps of 3σ, with σ = 7.29 × 10⁻³ and 6.35 × 10⁻³ Jy beam−1 km s−1, for the left and right panel, respectively.
Current usage metrics show cumulative count of Article Views (full-text article views including HTML views, PDF and ePub downloads, according to the available data) and Abstracts Views on Vision4Press platform.
Data correspond to usage on the plateform after 2015. The current usage metrics is available 48-96 hours after online publication and is updated daily on week days.
Initial download of the metrics may take a while.