Free Access
Fig. D.11
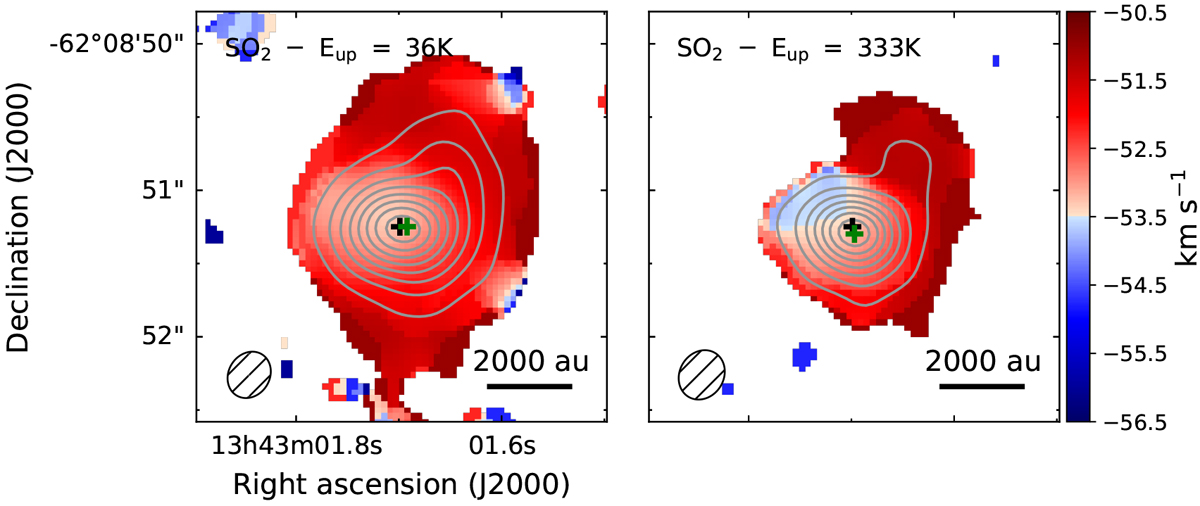
Same as Fig. 3 for SO2 lines at 256.2469 GHz (left) and 238.9925 GHz (right). Contours start at 9σ and are in steps of 12σ, with σ = 1.96 × 10⁻² and 8.63 × 10⁻³ Jy beam−1 km s−1, for the left and right panels, respectively.
Current usage metrics show cumulative count of Article Views (full-text article views including HTML views, PDF and ePub downloads, according to the available data) and Abstracts Views on Vision4Press platform.
Data correspond to usage on the plateform after 2015. The current usage metrics is available 48-96 hours after online publication and is updated daily on week days.
Initial download of the metrics may take a while.