Free Access
Fig. 2
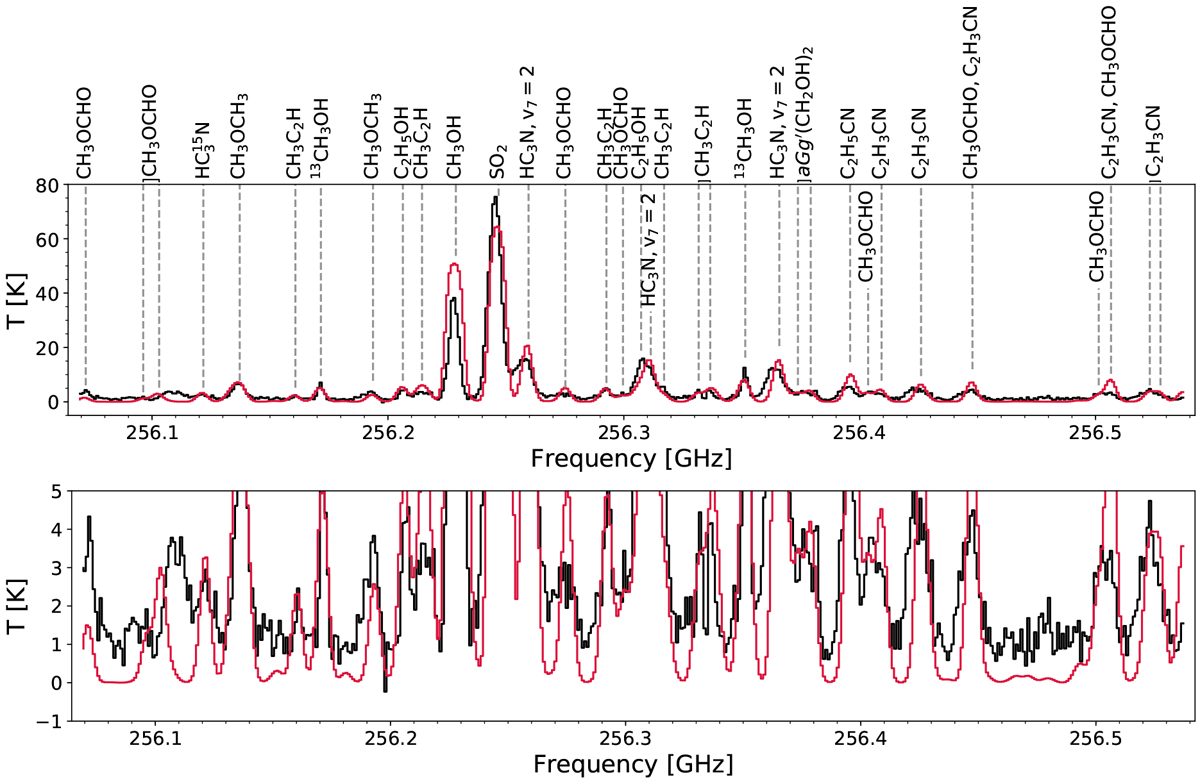
Full model (red), i.e., the sum of synthetic spectra, for all species detected towards AFGL 4176 in the spectral window centred at 256.3 GHz. Frequencies are shifted to the systemic velocity of the region. The data are shown in black. Bottom panel: zoom-in of the top panel to highlight weak lines.
Current usage metrics show cumulative count of Article Views (full-text article views including HTML views, PDF and ePub downloads, according to the available data) and Abstracts Views on Vision4Press platform.
Data correspond to usage on the plateform after 2015. The current usage metrics is available 48-96 hours after online publication and is updated daily on week days.
Initial download of the metrics may take a while.