Free Access
Fig. 1
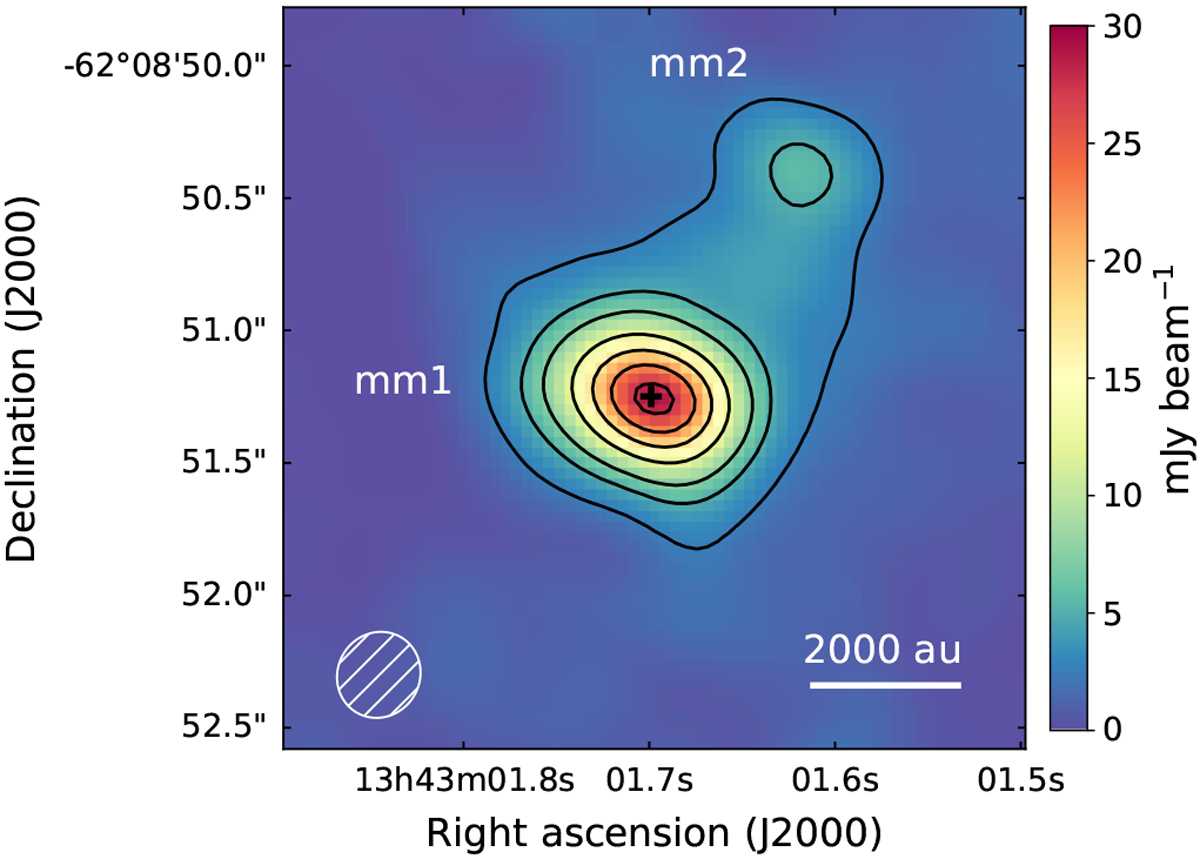
Continuum image of AFGL 4176 at 1.2 mm. Contours are [5, 10, 15, 25, 35, 45, 55]σ, with σ = 0.5 mJy beam−1. The peak continuum location at which the spectra have been extracted is marked by the black cross. The synthesised beam (0′′.33 × 0′′.31 ~1210 × 1140 au) is shown in the bottom left corner.
Current usage metrics show cumulative count of Article Views (full-text article views including HTML views, PDF and ePub downloads, according to the available data) and Abstracts Views on Vision4Press platform.
Data correspond to usage on the plateform after 2015. The current usage metrics is available 48-96 hours after online publication and is updated daily on week days.
Initial download of the metrics may take a while.