Fig. 5.
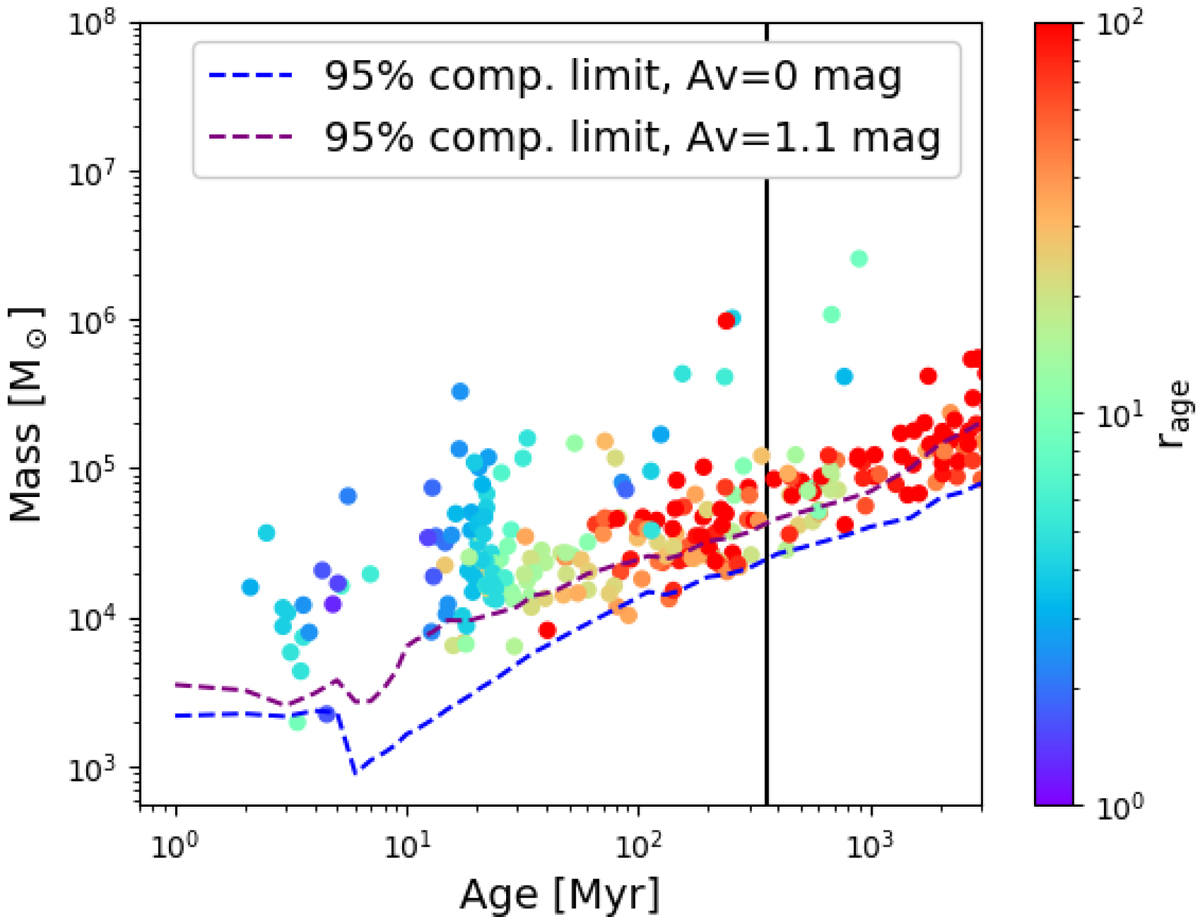
Estimated mass-age distribution for the cluster candidates. The color indicates the width of the age PDF, as defined in the text. The two dashed lines indicates the 95% completeness limit in the age-mass plane, assuming a given extinction. The black line shows the estimated time of the interaction that created this system (see text).
Current usage metrics show cumulative count of Article Views (full-text article views including HTML views, PDF and ePub downloads, according to the available data) and Abstracts Views on Vision4Press platform.
Data correspond to usage on the plateform after 2015. The current usage metrics is available 48-96 hours after online publication and is updated daily on week days.
Initial download of the metrics may take a while.