Fig. 16
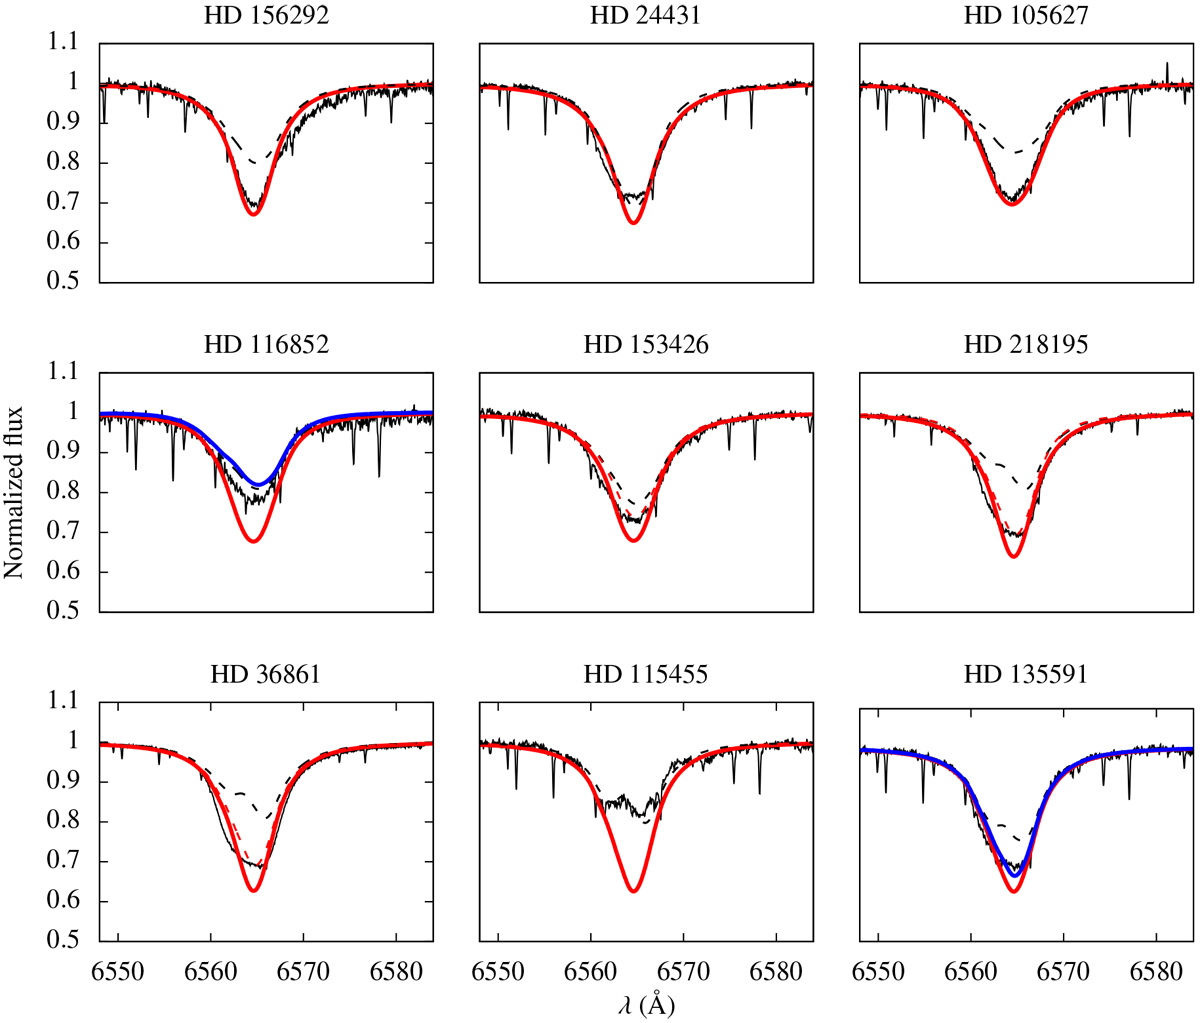
Mass-loss rates from fitting Hα. Our final models (UV Ṁ) are shown in solid red: “models (i)”. Upper limits on UV Ṁ that encompass the observed Hα line are shown in blue for some stars: “models (ii)”. Models with ṀVink are presented in dashed black: “models (iii)”. Again, only the models with ṀVink are homogeneous. When none of the previous models are able to adjust the Hα intensity, we provide a new Ṁ determination from fitting Hα (dashed-red): “models (iv)”. The text gives further details concerning the notations “models (i–iv)”.
Current usage metrics show cumulative count of Article Views (full-text article views including HTML views, PDF and ePub downloads, according to the available data) and Abstracts Views on Vision4Press platform.
Data correspond to usage on the plateform after 2015. The current usage metrics is available 48-96 hours after online publication and is updated daily on week days.
Initial download of the metrics may take a while.