Fig. 11
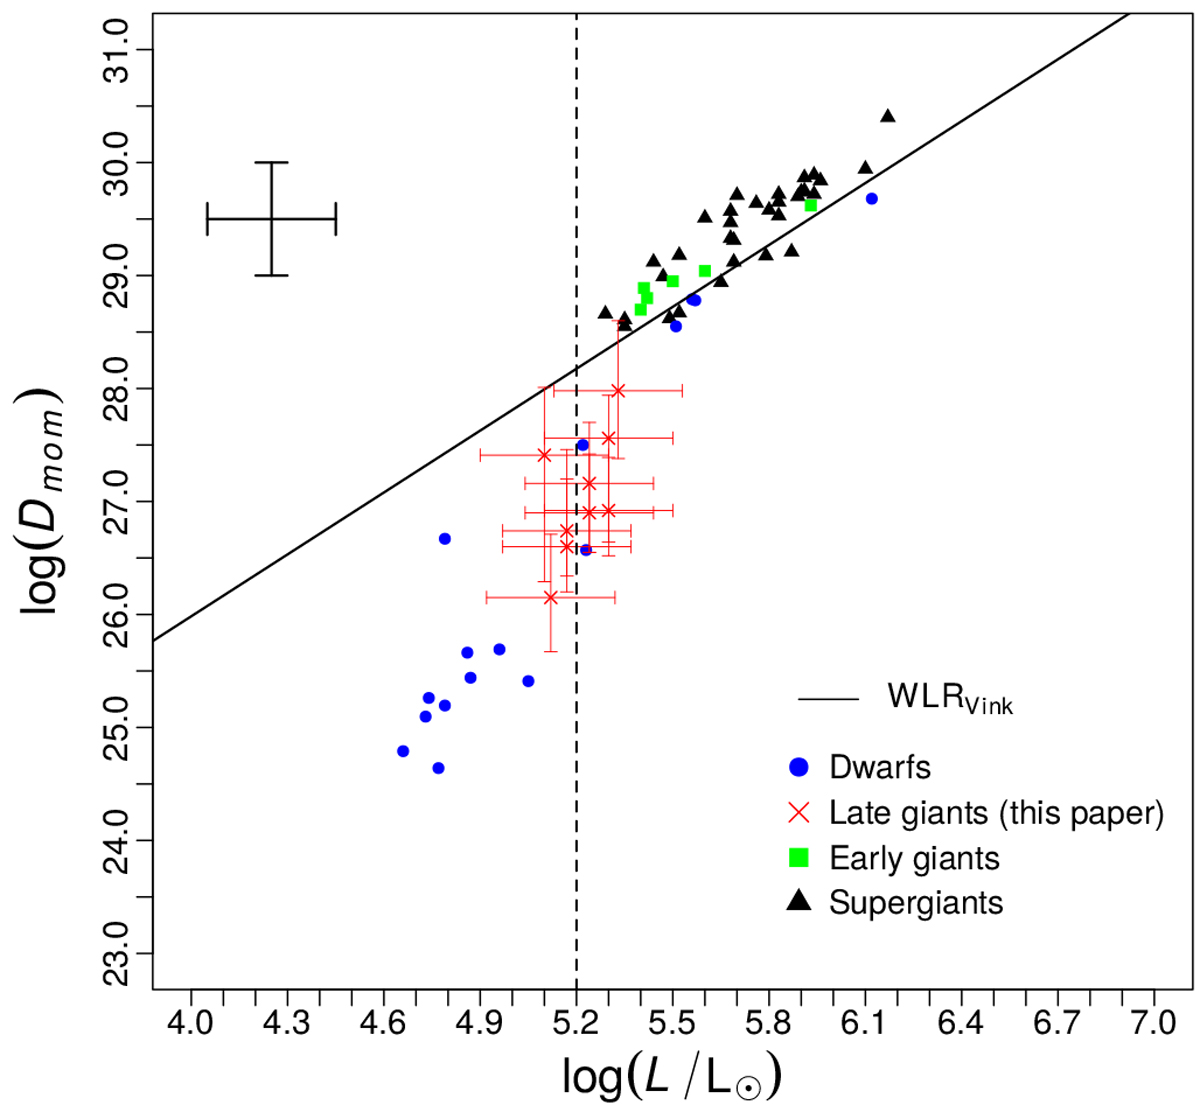
Wind momentum-luminosity diagram for O dwarfs, giants, and supergiants. Colors and geometric figures stand as in Fig. 8, our results are shown in red crosses. Our results are derived from the UV analysis. All the spectroscopic results consider (or are scaled to) unclumped Ṁ. The theoretical relation of Vink et al. (2000) is in solid black. We mark log (L⋆ ∕L⊙) = 5.2 in dashed black line, and representative error bars for the literature results are shown in the top left.
Current usage metrics show cumulative count of Article Views (full-text article views including HTML views, PDF and ePub downloads, according to the available data) and Abstracts Views on Vision4Press platform.
Data correspond to usage on the plateform after 2015. The current usage metrics is available 48-96 hours after online publication and is updated daily on week days.
Initial download of the metrics may take a while.