Fig. 6
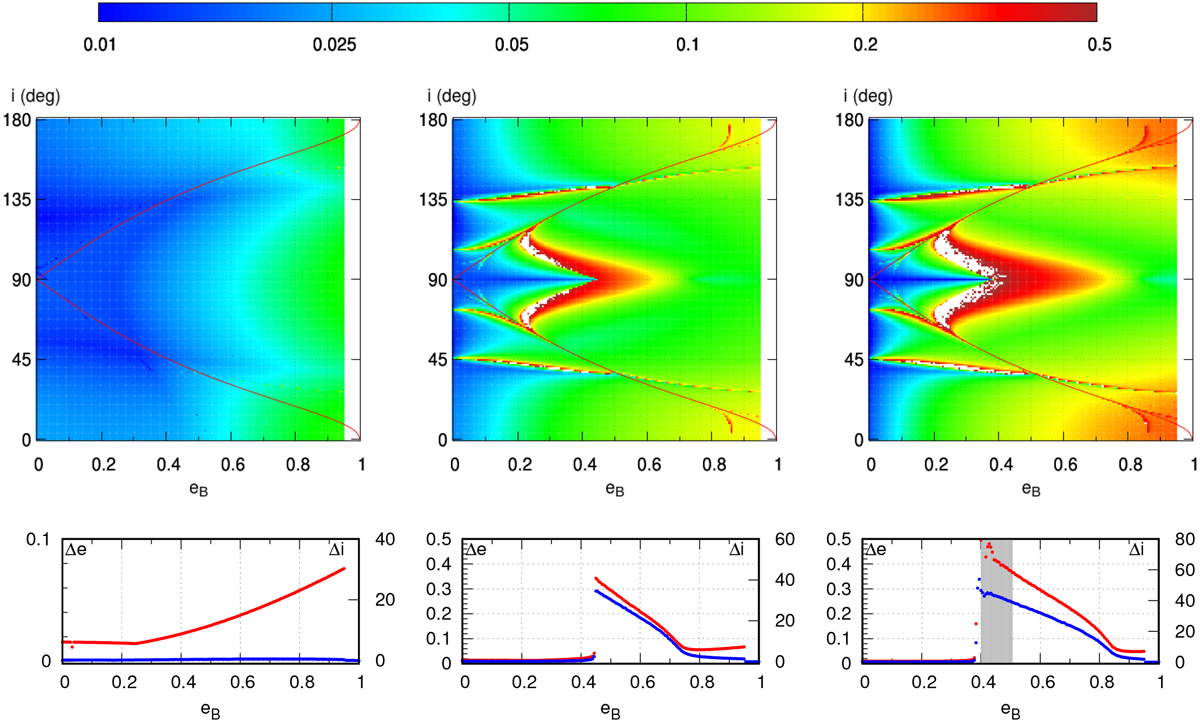
Top panels: dynamical maps of inclined configurations with Ω = 90° with q = 1, 0.5, 0.2 (from left to right). The colour scale corresponds to the eccentricity variation Δe of the orbit. The continuous red lines are defined by Eq. (1) and correspond to the analytic limit between polar and prograde or retrograde orbits. Bottom panels: longitudinal cuts of the dynamical maps at i = 90°. The amplitude of Δe (Δi) is shown in red (blue). The grey shaded areas correspond to chaotic orbits with ⟨Y ⟩ ≫ 2.
Current usage metrics show cumulative count of Article Views (full-text article views including HTML views, PDF and ePub downloads, according to the available data) and Abstracts Views on Vision4Press platform.
Data correspond to usage on the plateform after 2015. The current usage metrics is available 48-96 hours after online publication and is updated daily on week days.
Initial download of the metrics may take a while.