Fig. 5
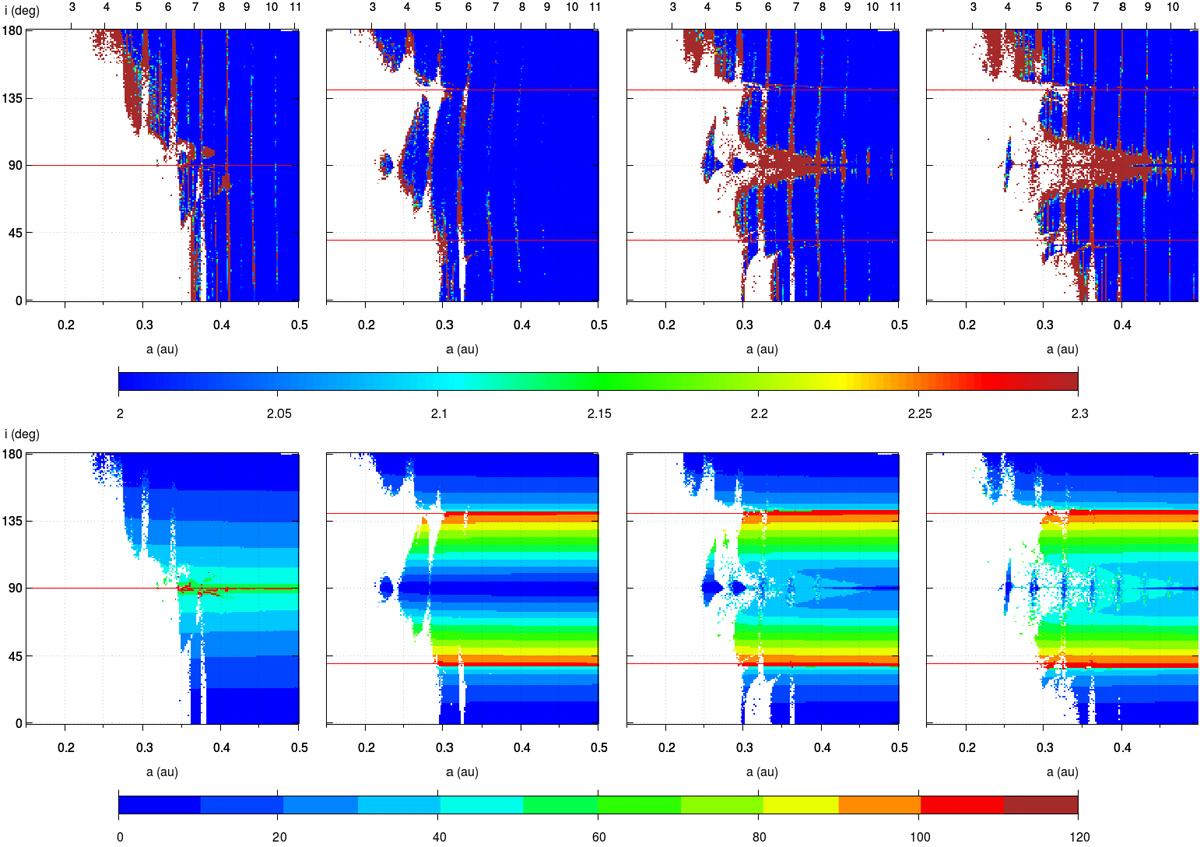
Dynamical maps of inclined systems with M = 1 M⊙ (from left to right): {q = 1, Ω = 0°}, {q = 1, Ω = 90°}, {q = 0.5, Ω = 90°}, and {q = 0.2, Ω = 90°}. The top labels correspond to the period in terms of binary periods. The regions between the horizontal red lines correspond to real polar orbits (i.e. librating around i = 90°). Long-term integrations show that particles with initial conditions in the red/brown regions do not survive more than 105 periods. When Ω = 90°, stability islands appear at polar inclinations closer to the binary (between 2 and 3 aB). In the bottom panel, the colour scale shows the amplitude of libration of i. The continuous red lines are defined by Eq. (2) and correspond to the analytic limits between polar and prograde or retrograde orbits.
Current usage metrics show cumulative count of Article Views (full-text article views including HTML views, PDF and ePub downloads, according to the available data) and Abstracts Views on Vision4Press platform.
Data correspond to usage on the plateform after 2015. The current usage metrics is available 48-96 hours after online publication and is updated daily on week days.
Initial download of the metrics may take a while.