Fig. 2
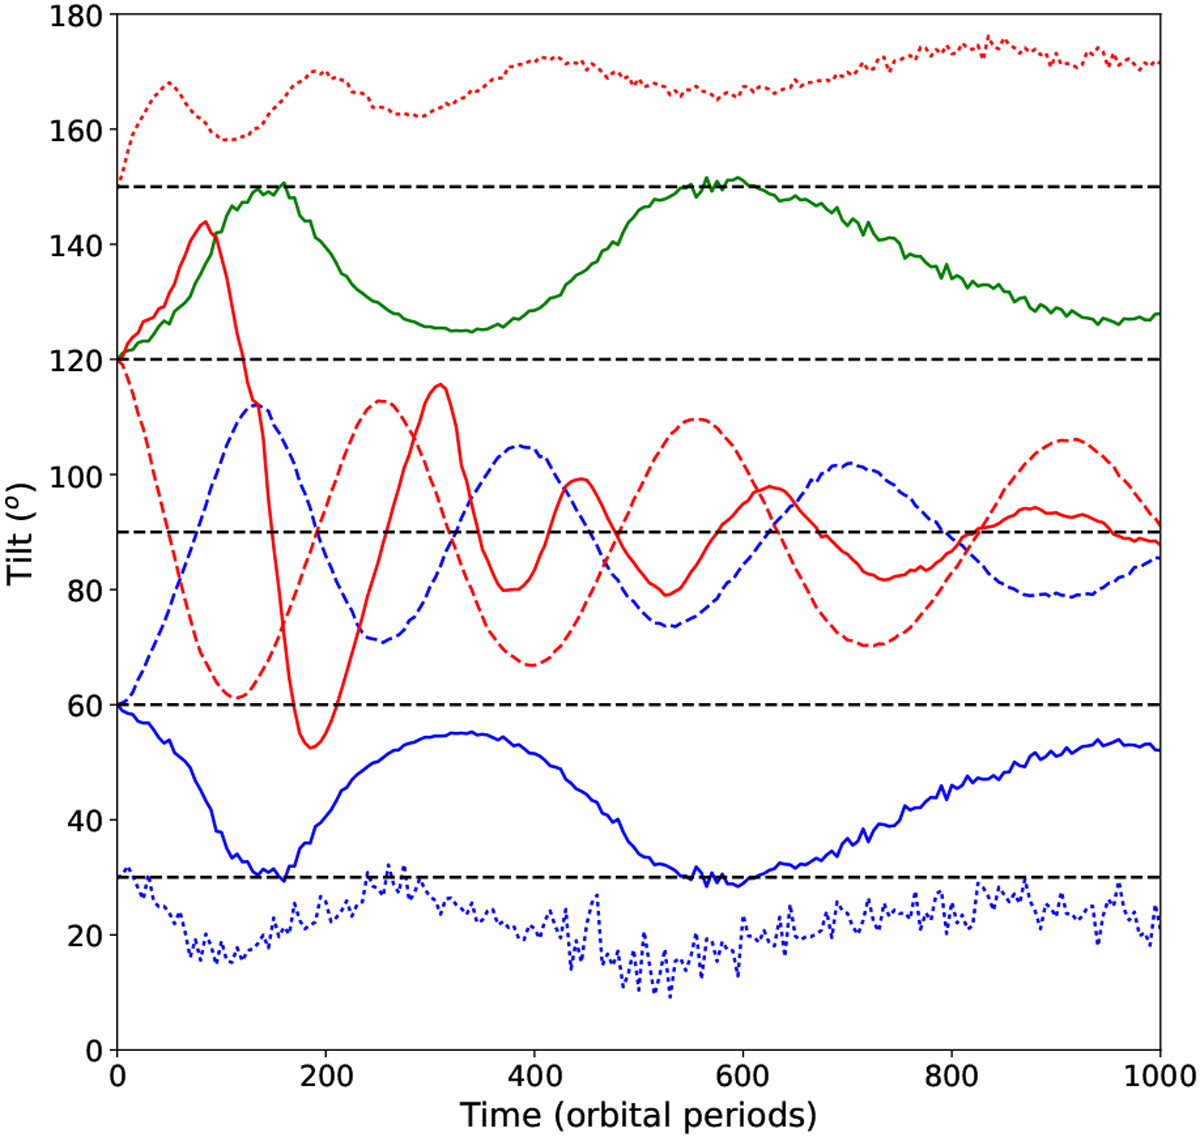
Tilt evolution over time, i(t), in terms of binary orbital periods. Runs: r1 (solid blue), r2 (dashed blue), r3 (solid red), r4 (dashed red), r5 (dotted red), and r6 (dotted blue). For comparison with r3, we also plot the symmetric curve of r1 with respect to i = 90° (solid green). r3 shows an anomalous behaviour because the disc breaks in two discs after ~ 150 orbits, which then evolve towards polar alignment (see Sect. 3.3).
Current usage metrics show cumulative count of Article Views (full-text article views including HTML views, PDF and ePub downloads, according to the available data) and Abstracts Views on Vision4Press platform.
Data correspond to usage on the plateform after 2015. The current usage metrics is available 48-96 hours after online publication and is updated daily on week days.
Initial download of the metrics may take a while.