Fig. 7
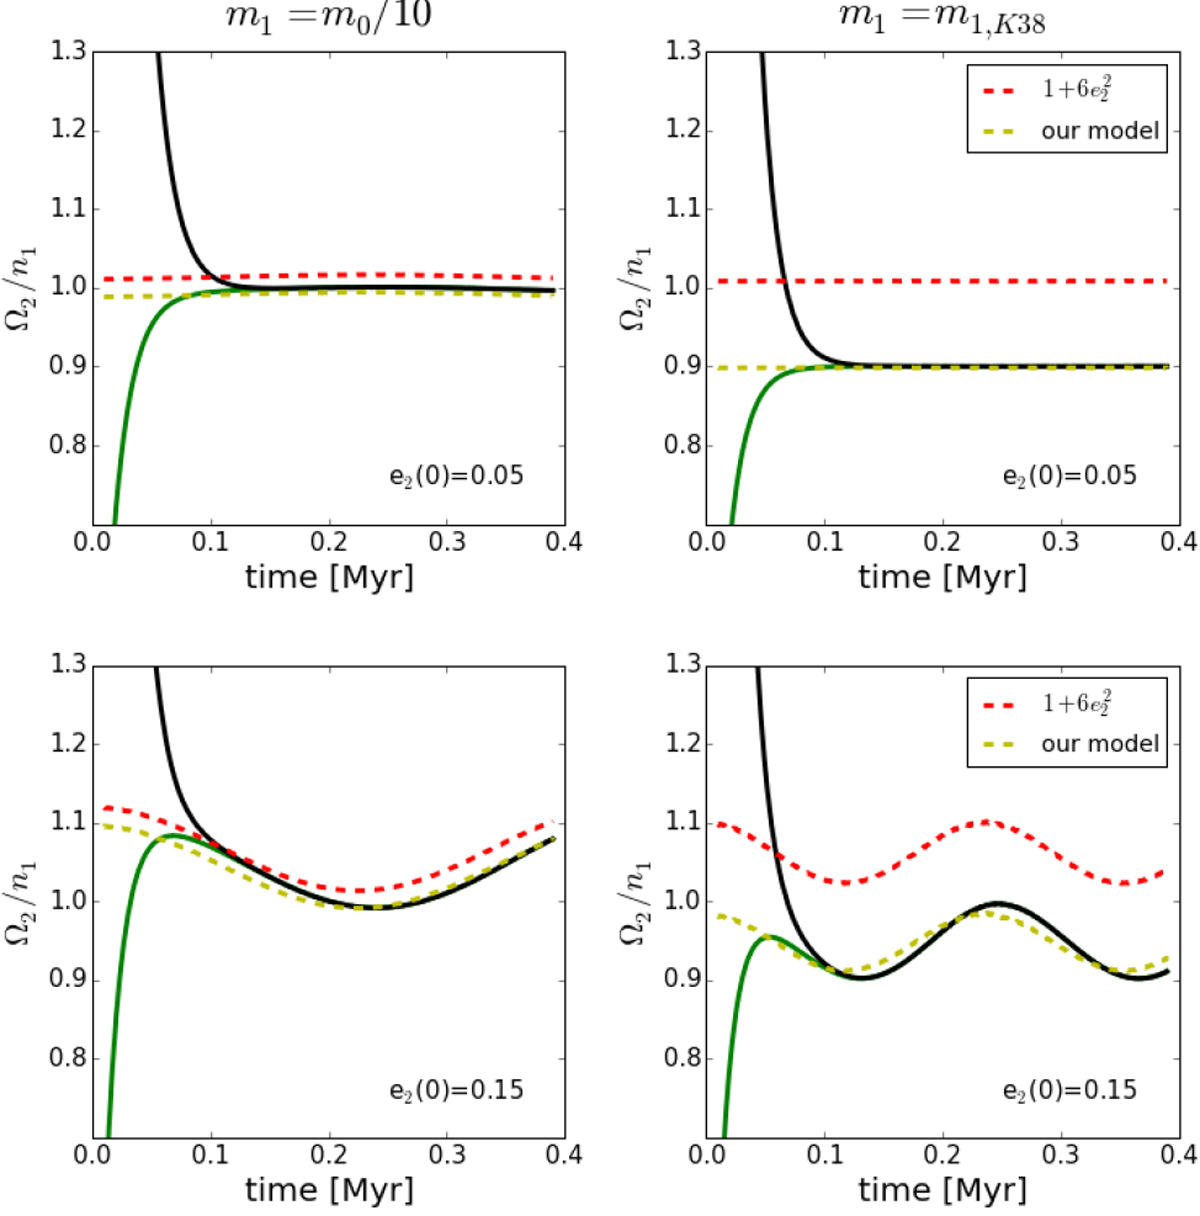
N-body simulation of the spin evolution of fictitious CB planets, considering binaries with different mass ratios (different columns) and different initial eccentricity for the planets (different rows). In all the panels, the black curves correspond to the evolution of an initially super-synchronous planet while the green curves represent the initially sub-synchronous case. The dashed yellow curves are the stationary spins predicted by our model (Eq. (22)) while the dashed red curves are the 2-body stationary solution.
Current usage metrics show cumulative count of Article Views (full-text article views including HTML views, PDF and ePub downloads, according to the available data) and Abstracts Views on Vision4Press platform.
Data correspond to usage on the plateform after 2015. The current usage metrics is available 48-96 hours after online publication and is updated daily on week days.
Initial download of the metrics may take a while.