Fig. 5
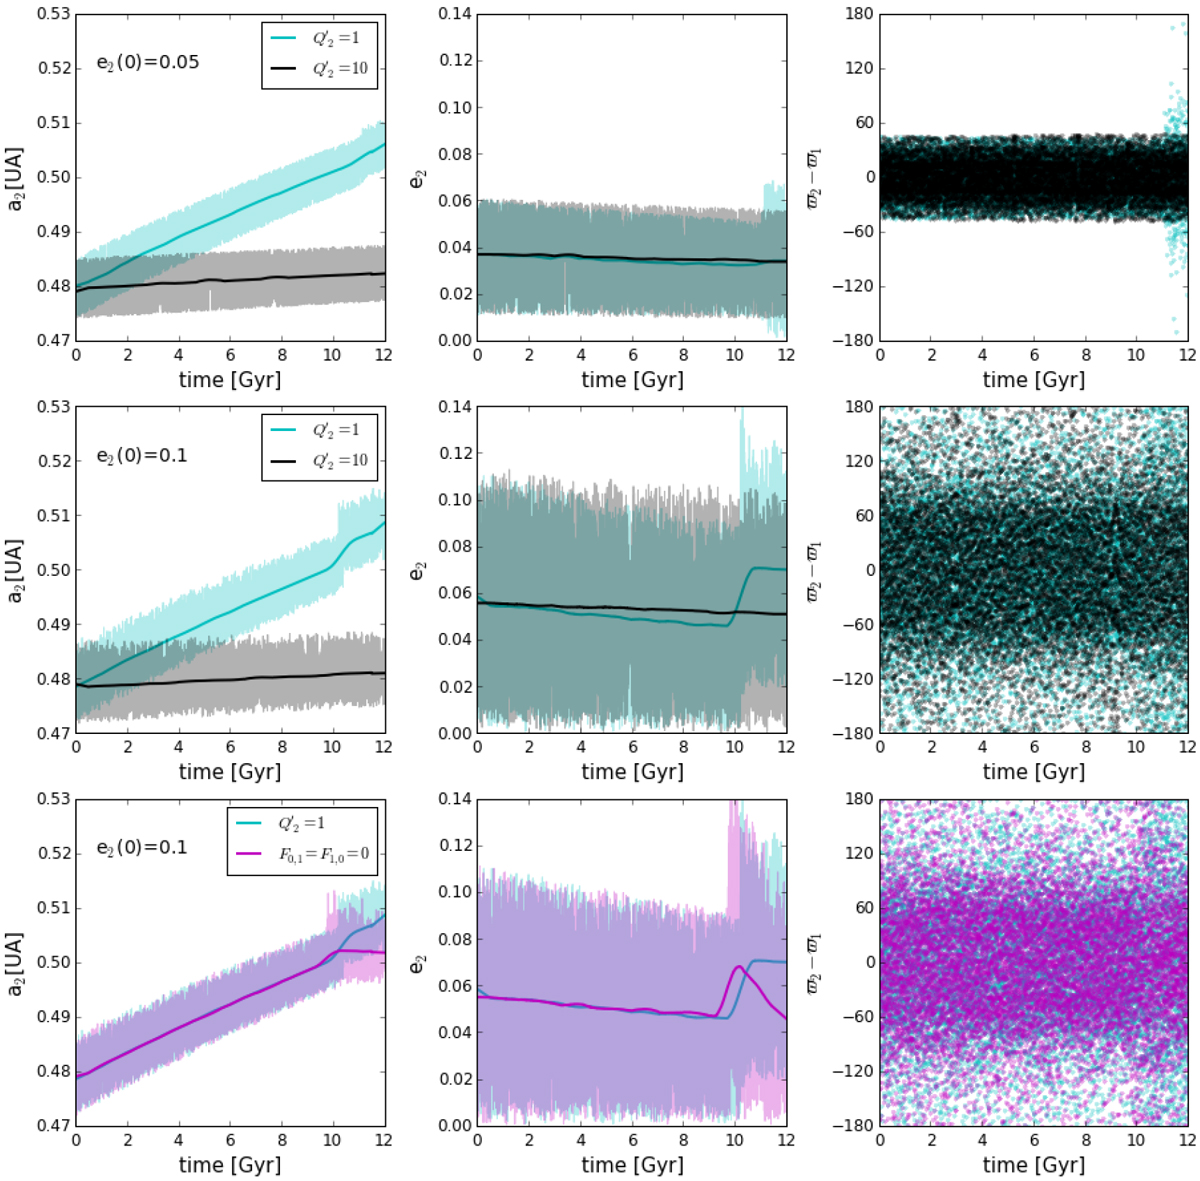
Long-term orbital tidal evolution of our planet in our Kepler-38-like system. Except for the parameters inlaid in the left-hand plots, all parameters and initial conditions were taken equal to those in Table 1. Light-tone curves for a2 and e2 show osculating values while darker curves correspond to mean elements obtained from a digital filter. The magenta curves in the lower panels are the result of a simulation disregarding tidal interaction between the stars.
Current usage metrics show cumulative count of Article Views (full-text article views including HTML views, PDF and ePub downloads, according to the available data) and Abstracts Views on Vision4Press platform.
Data correspond to usage on the plateform after 2015. The current usage metrics is available 48-96 hours after online publication and is updated daily on week days.
Initial download of the metrics may take a while.