Fig. 4
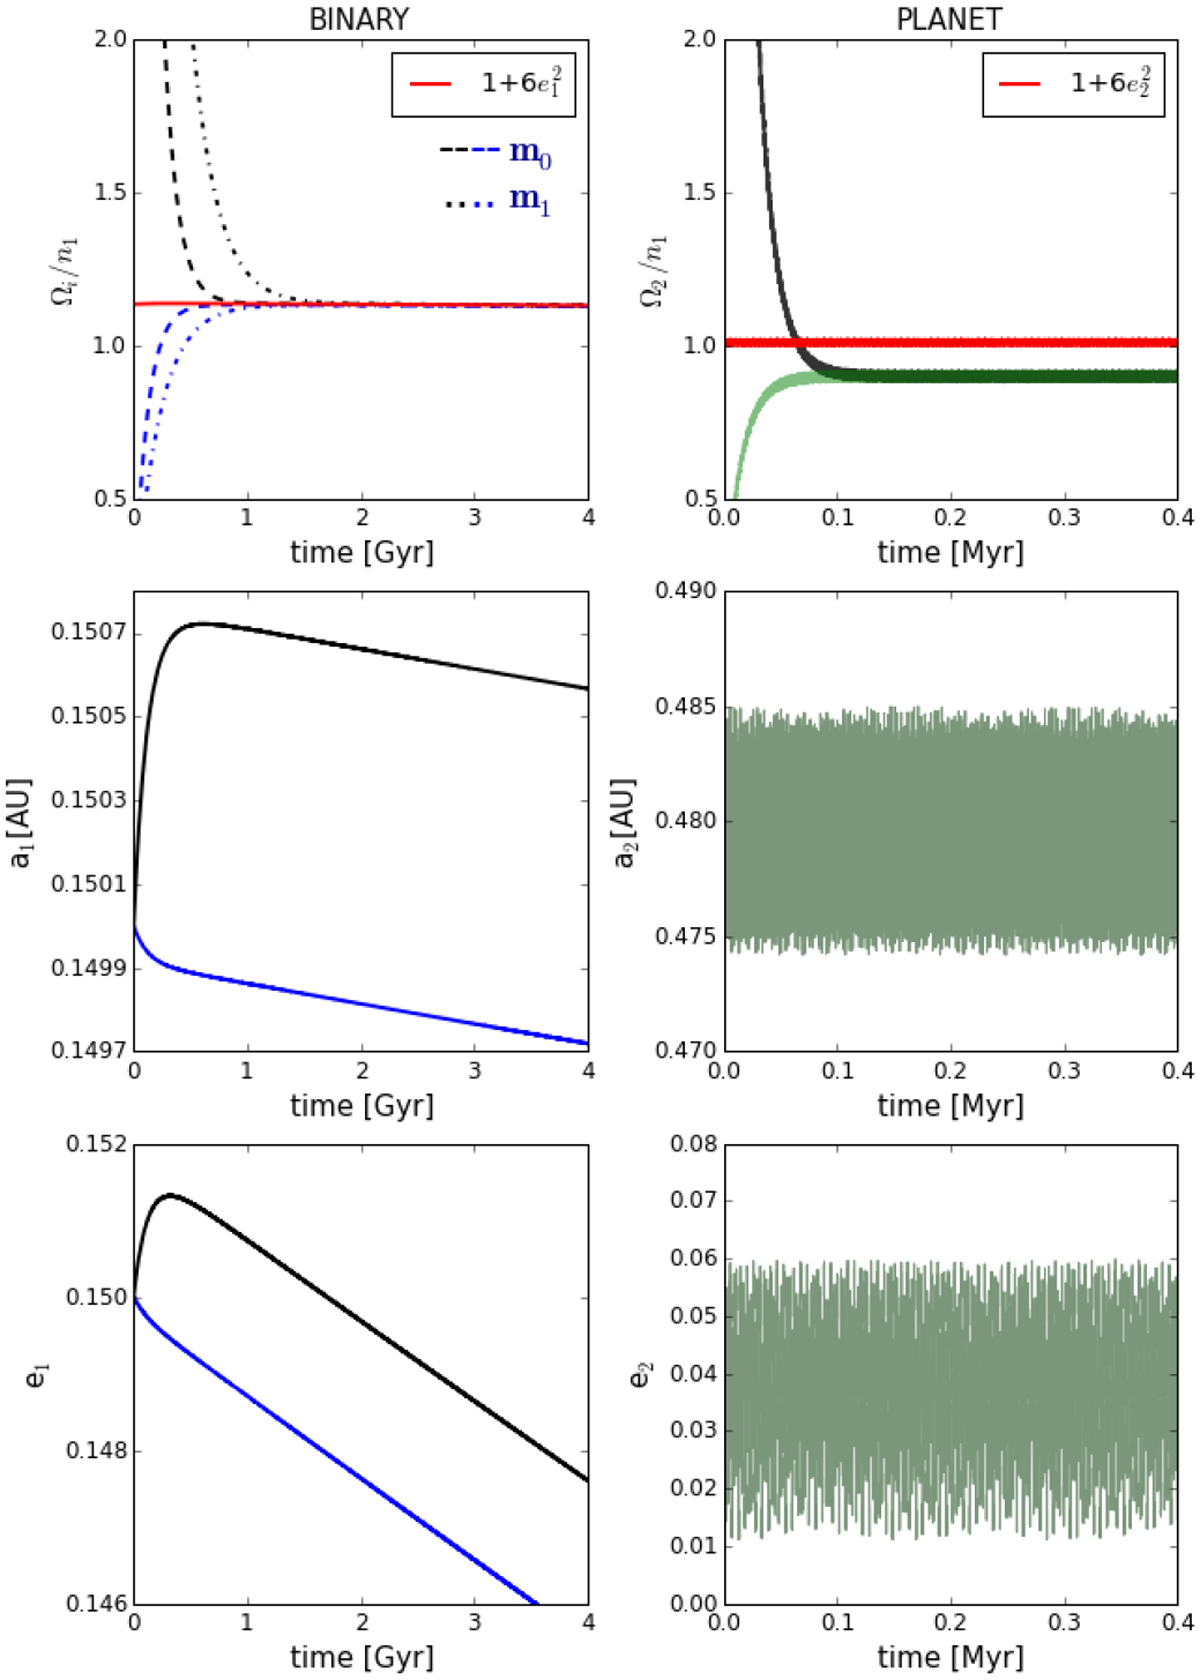
Early tidal evolution of a circumbinary system. In all the panels, the black curve represents the results of our reference simulation (Table 1). Left: dynamical evolution of the binary, showing the spin rate (top), semimajor axis (middle) and eccentricity (bottom panel). The results depicted in blue consider initially slow-rotating stars with Ω0 ∕ n1 = Ω1 ∕ n1 = 0.1 (at t = 0), while those in black correspond to primordial fast rotators Ω0 ∕ n1 = Ω1 ∕ n1 = 10. Right: evolution of the planetary spin and orbit. Black (respectively green) curves correspond to initial super-synchronous (respectively sub-synchronous) planetary spin rates. Time variation of the semimajor axis a2 and eccentricity e2 are practically equal in both cases (middle and bottom panels).
Current usage metrics show cumulative count of Article Views (full-text article views including HTML views, PDF and ePub downloads, according to the available data) and Abstracts Views on Vision4Press platform.
Data correspond to usage on the plateform after 2015. The current usage metrics is available 48-96 hours after online publication and is updated daily on week days.
Initial download of the metrics may take a while.