Fig. 8.
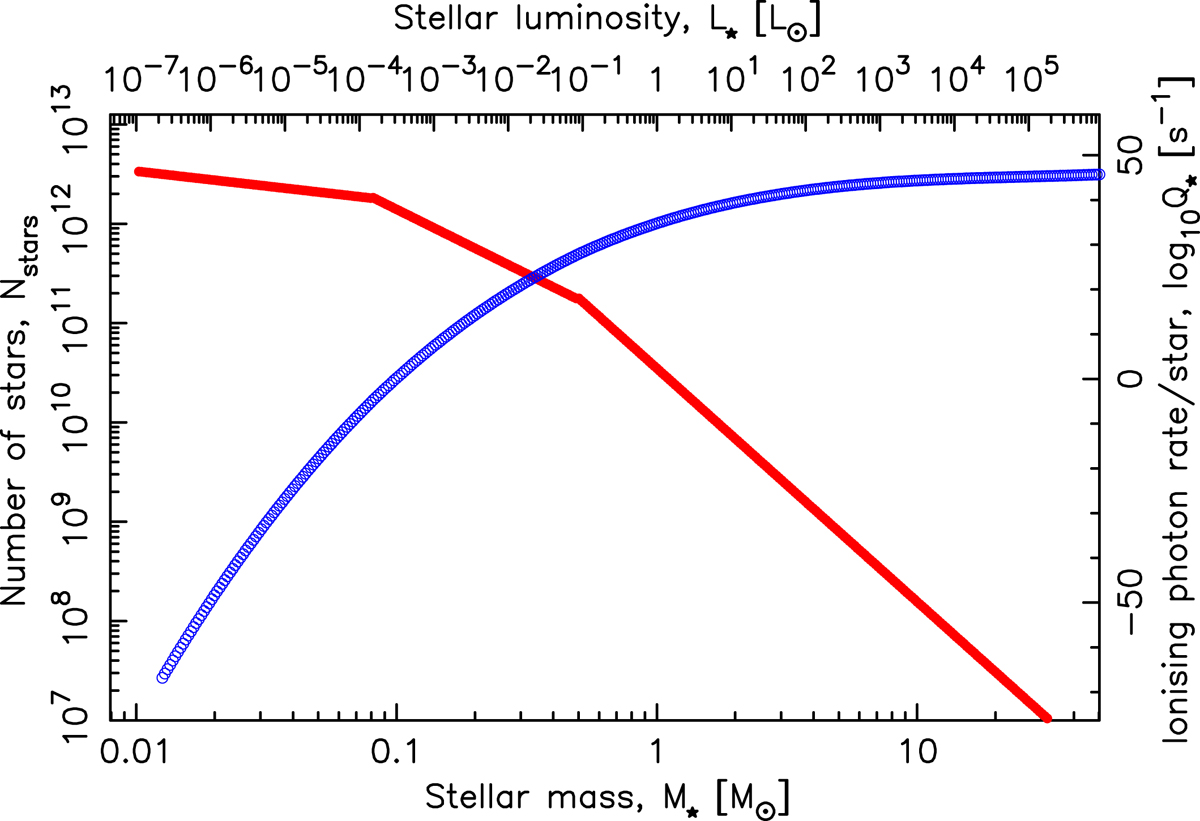
Frequency of various stellar masses obtained from the initial mass function, ξ = ξ0Mα, normalised to give a total stellar mass of Mtotal = 4 × 10¹¹ M⊙, α = −0.3 for 0.01 < M⊙ < 0.08, α = −1.3 for 0.08 < M⊙ < 0.5, and α = −2.35 for M⊙ > 0.5 (Salpeter 1955; Kroupa 2001). The curve (right-hand scale) shows the approximate ionising photon rate per star.
Current usage metrics show cumulative count of Article Views (full-text article views including HTML views, PDF and ePub downloads, according to the available data) and Abstracts Views on Vision4Press platform.
Data correspond to usage on the plateform after 2015. The current usage metrics is available 48-96 hours after online publication and is updated daily on week days.
Initial download of the metrics may take a while.