Free Access
Fig. 3.
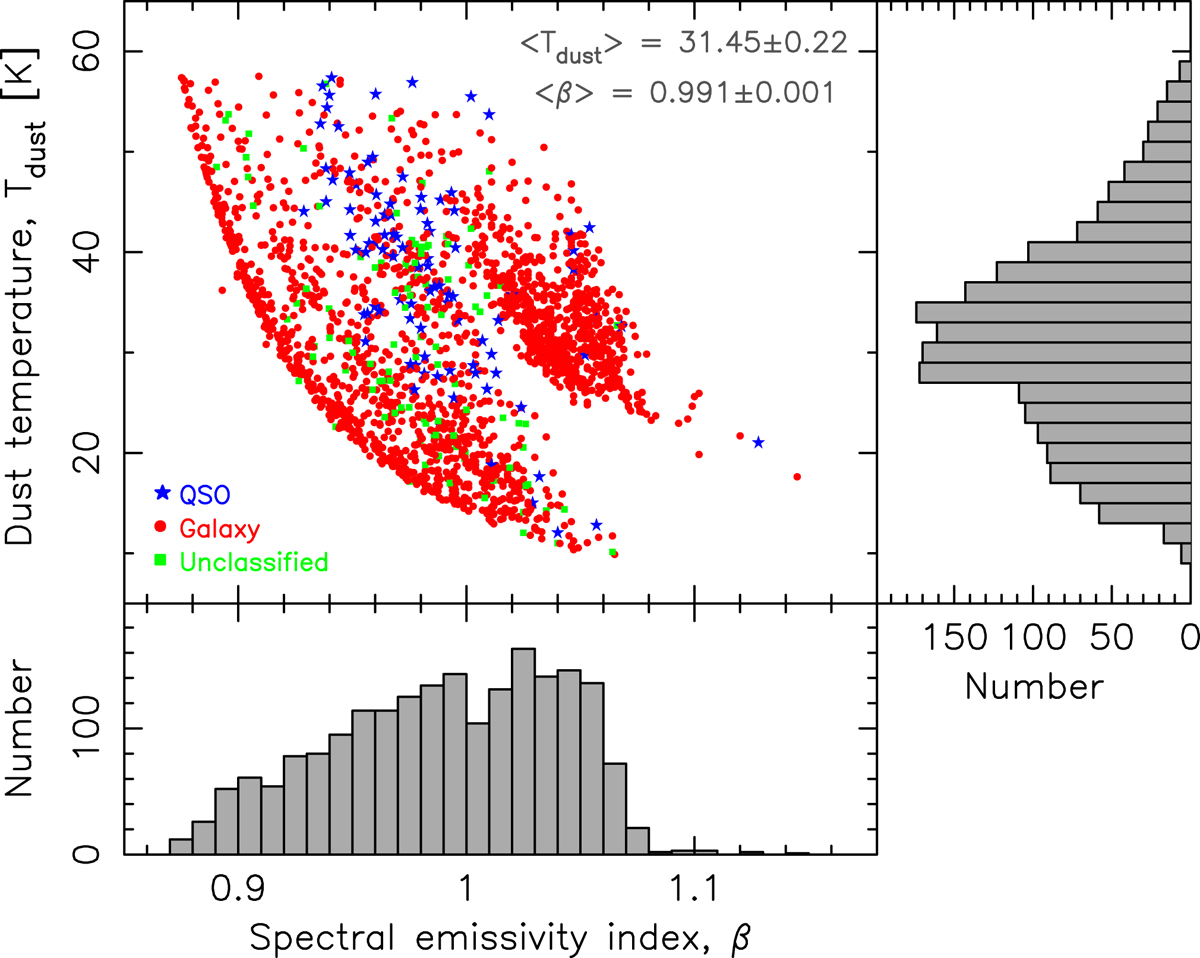
Distribution of spectral emissivity index and dust temperature, where Tdust ≤ 1.2 × 10¹²(z + 1)h/k, giving a sample of n = 2013. The shapes represent the NED classification: stars for QSOs, circles for galaxies, and squares for unclassified.
Current usage metrics show cumulative count of Article Views (full-text article views including HTML views, PDF and ePub downloads, according to the available data) and Abstracts Views on Vision4Press platform.
Data correspond to usage on the plateform after 2015. The current usage metrics is available 48-96 hours after online publication and is updated daily on week days.
Initial download of the metrics may take a while.