Fig. 9.
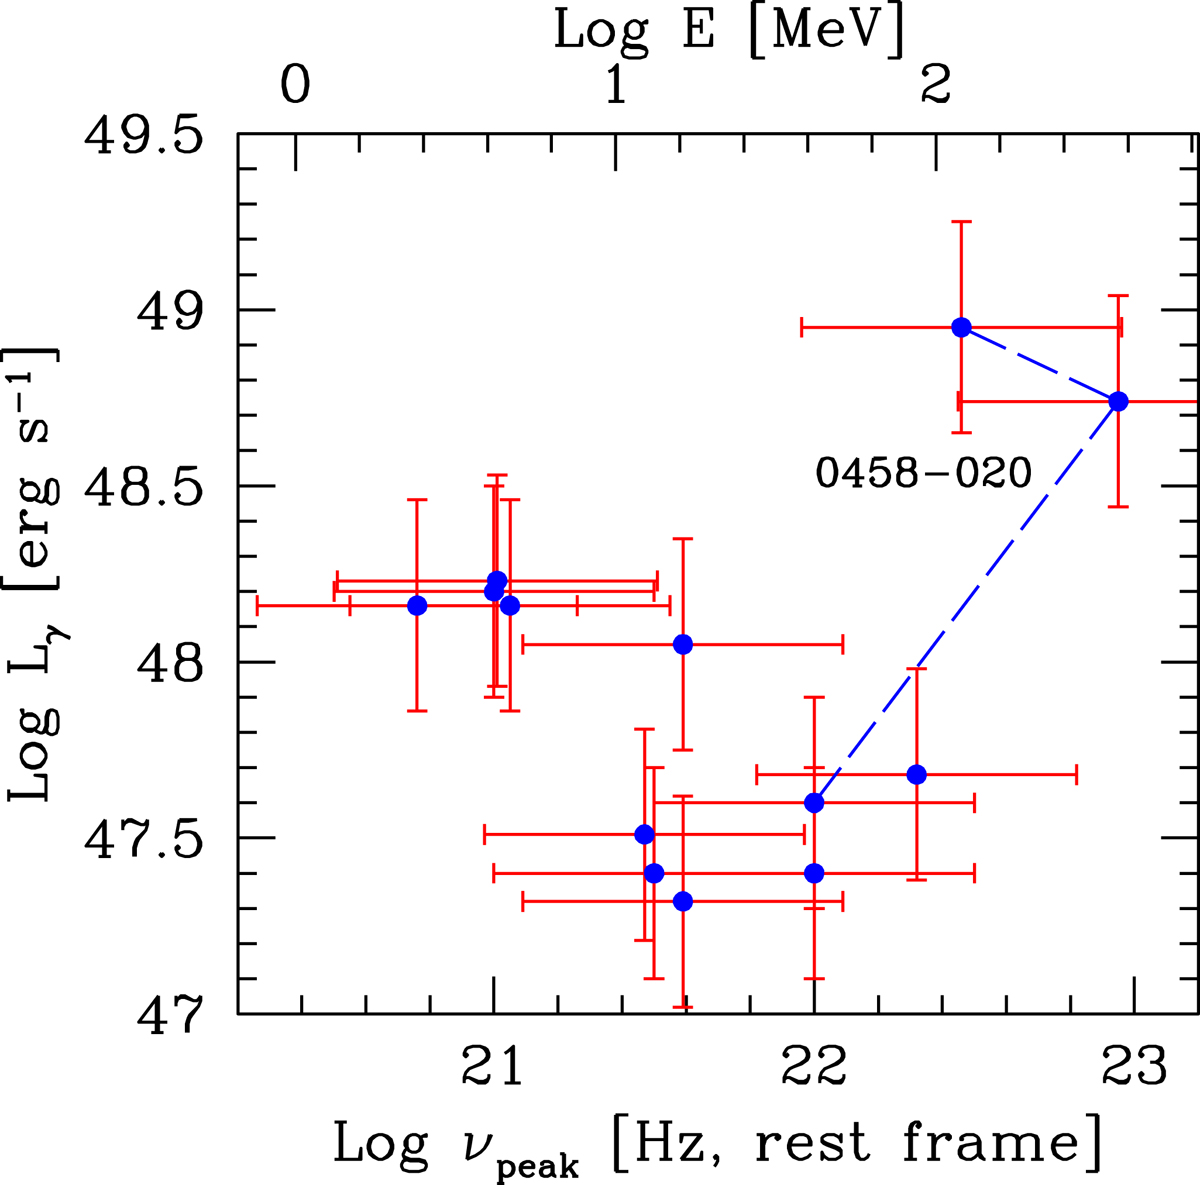
Peak luminosity of the high-energy component as a function of its peak frequency. The dashed line connects three different states of TXS 0458–020. Error bars correspond to factor 3 uncertainties in νpeak and factor 2 in Lγ. There is a weak trend of smaller luminosities for larger peak frequencies, with the exception of TXS 0458–020 when in the high state.
Current usage metrics show cumulative count of Article Views (full-text article views including HTML views, PDF and ePub downloads, according to the available data) and Abstracts Views on Vision4Press platform.
Data correspond to usage on the plateform after 2015. The current usage metrics is available 48-96 hours after online publication and is updated daily on week days.
Initial download of the metrics may take a while.