Fig. 6.
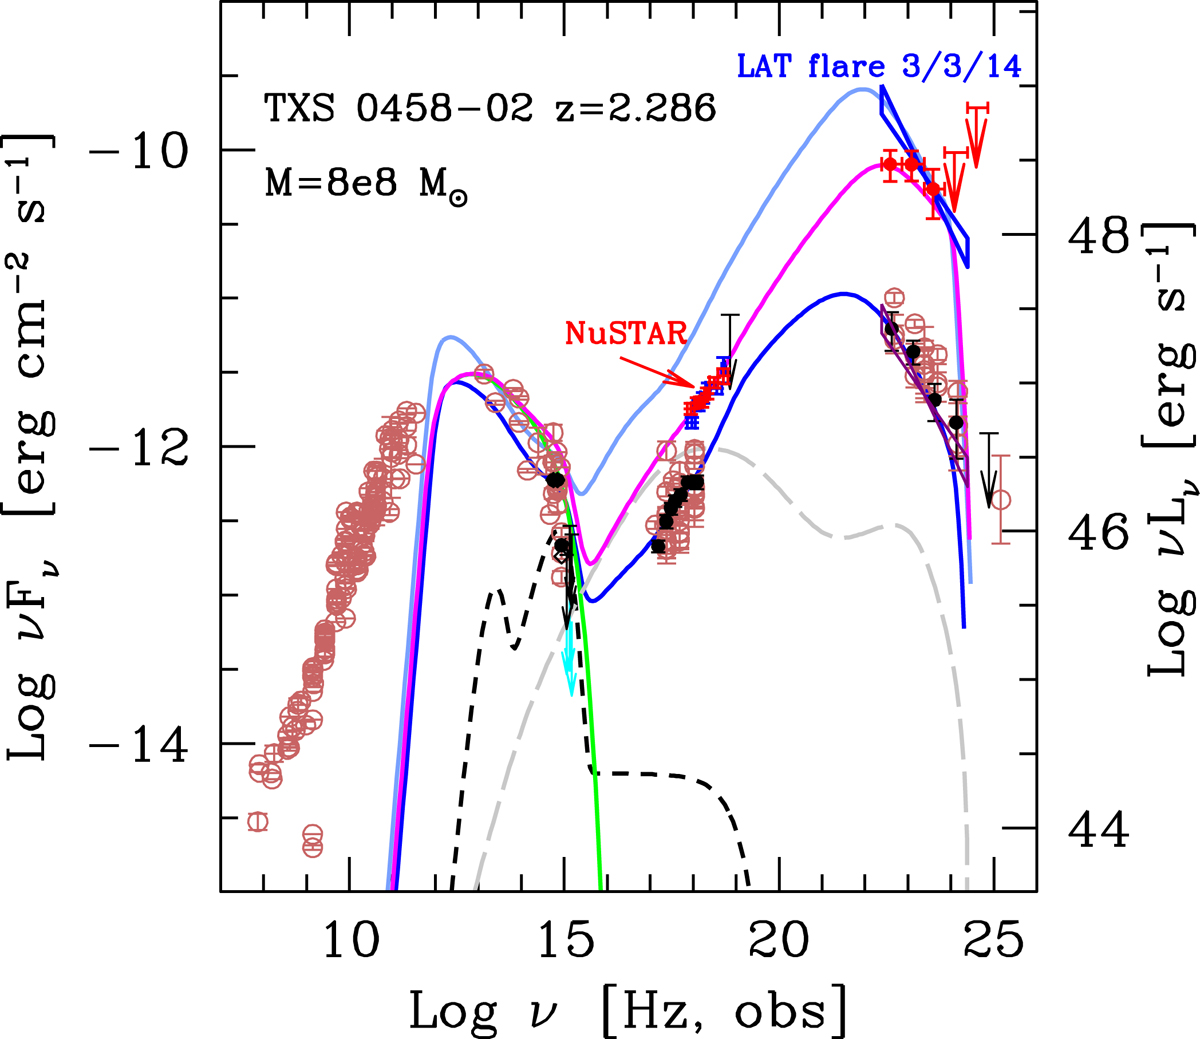
Overall SEDs of TXS 0458–02, showing the changes in the high-energy emission due to its strong variability. Since unfortunately there are no low-frequency (mm-optical) data simultaneous to the varying high-energy flux, the models shown assume a quasi-constant flux at these frequencies. This illustrates how the model parameters would change in this case.
Current usage metrics show cumulative count of Article Views (full-text article views including HTML views, PDF and ePub downloads, according to the available data) and Abstracts Views on Vision4Press platform.
Data correspond to usage on the plateform after 2015. The current usage metrics is available 48-96 hours after online publication and is updated daily on week days.
Initial download of the metrics may take a while.