Free Access
Fig. 5.
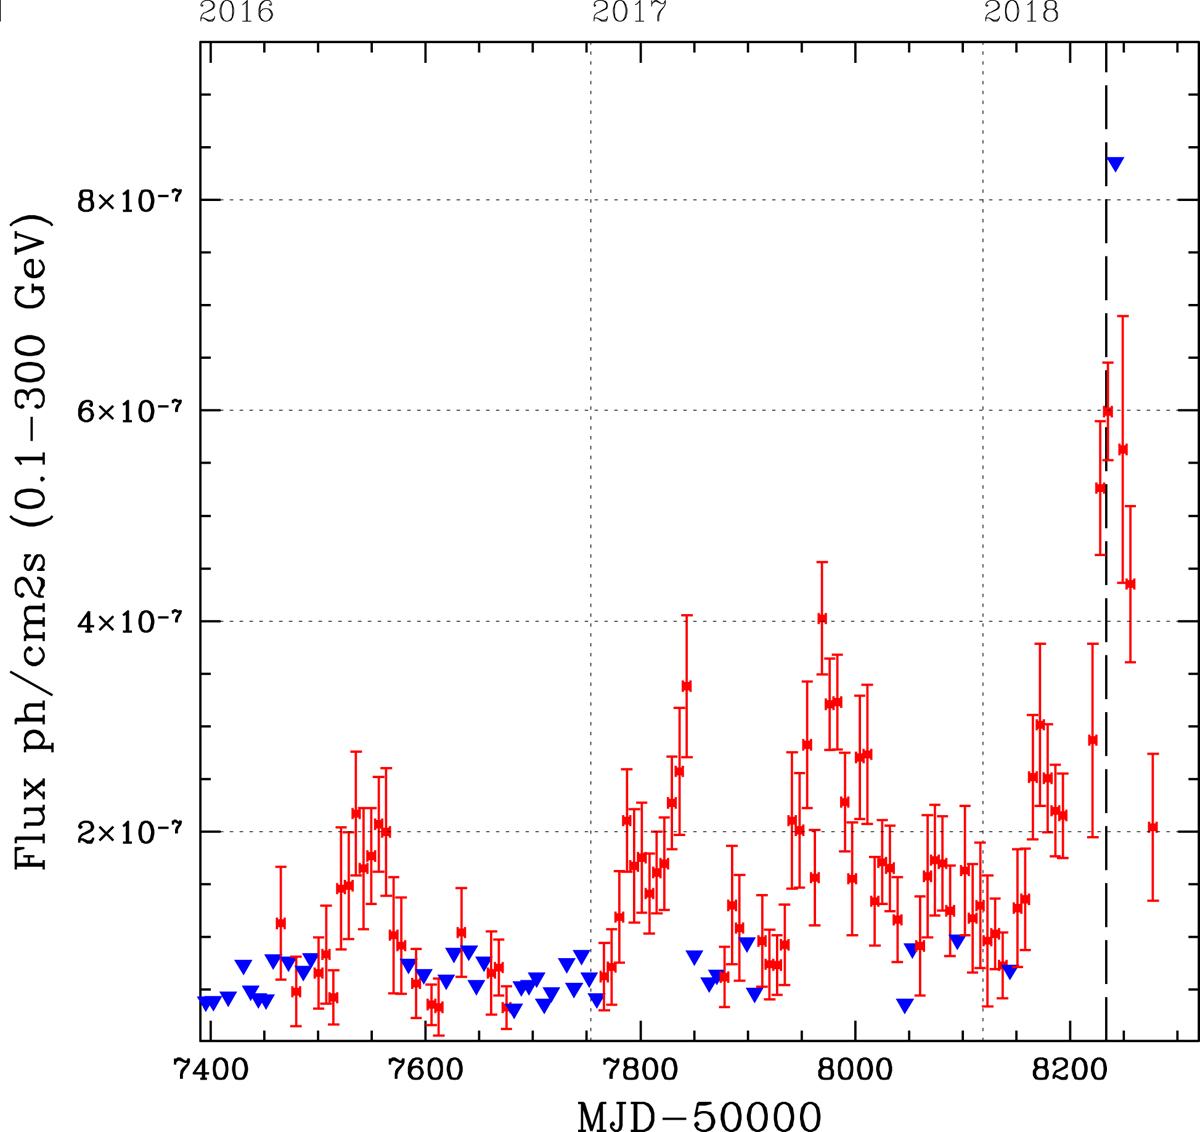
γ-ray light curve of TXS 0458–02. Blue triangles are 95% upper limits, calculated assuming a power law with photon spectral index Γ = 2. The dashed vertical line corresponds to the NuSTAR observation epoch, when the source was in a very high γ-ray state.
Current usage metrics show cumulative count of Article Views (full-text article views including HTML views, PDF and ePub downloads, according to the available data) and Abstracts Views on Vision4Press platform.
Data correspond to usage on the plateform after 2015. The current usage metrics is available 48-96 hours after online publication and is updated daily on week days.
Initial download of the metrics may take a while.