Fig. 1.
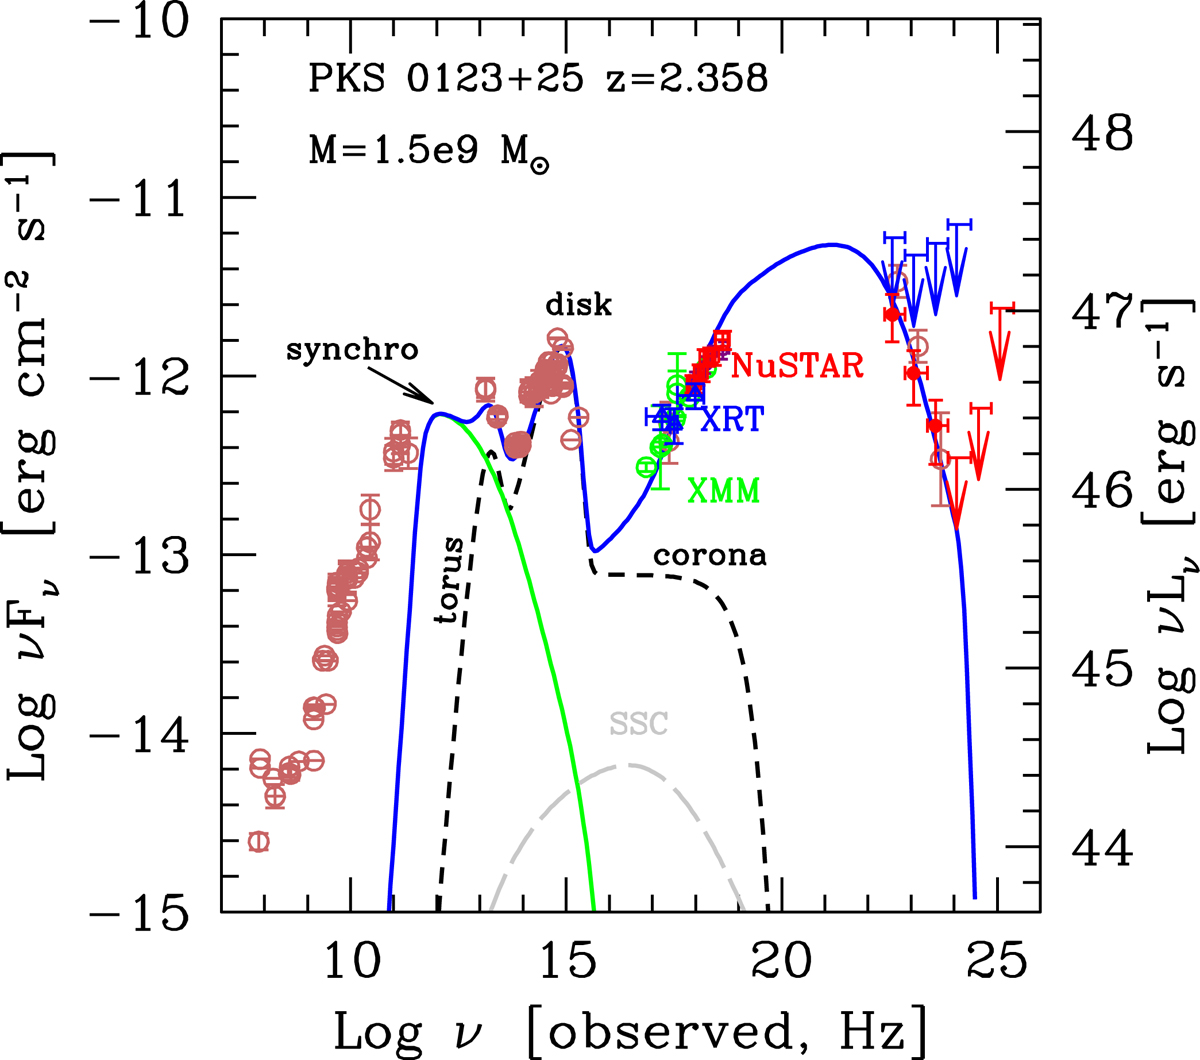
Overall SEDs of PKS 0123+25. Besides our data (red points), we show the archival data collected from the ASI/SSDC database. We have indicated in green the XMM-Newton data, taken in January 2009, and in blue the Swift/XRT data taken simultaneously with the NuSTAR observation. The blue arrows in the γ-ray band are upper limits obtained integrating over 30 days (15 days before and 15 days after the NuSTAR observation). Red γ-ray points and arrows correspond to the average flux during the last 4 years. The lines are the result of the modeling (see text).
Current usage metrics show cumulative count of Article Views (full-text article views including HTML views, PDF and ePub downloads, according to the available data) and Abstracts Views on Vision4Press platform.
Data correspond to usage on the plateform after 2015. The current usage metrics is available 48-96 hours after online publication and is updated daily on week days.
Initial download of the metrics may take a while.