Fig. 3.
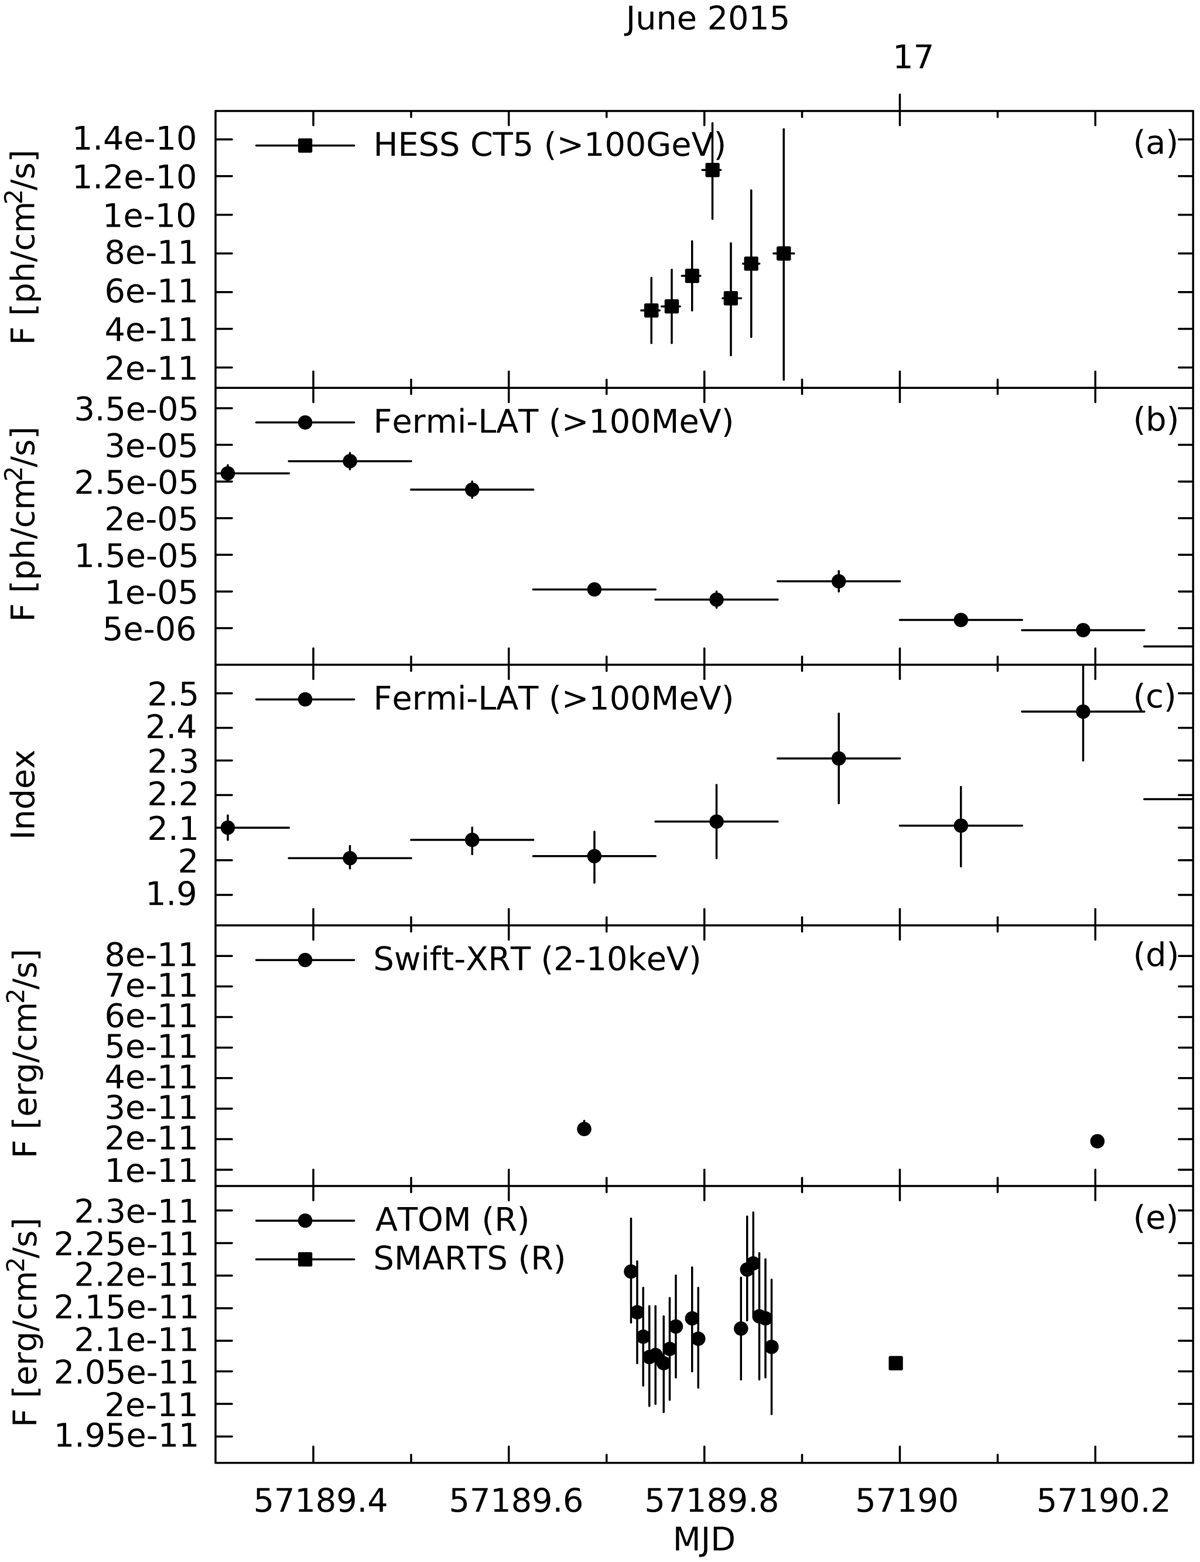
Observed multiwavelength lightcurves zoomed in on Night 2. (a) H.E.S.S. lightcurve derived above an energy threshold of 100 GeV in run-wise time bins. (b) Fermi-LAT lightcurve integrated above 100 MeV in 3 h bins. (c) HE γ-ray photon index measured with Fermi-LAT in 3 h bins. (d) Swift-XRT lightcurve integrated between 2 and 10 keV for individual pointings. (e) Optical R band lightcurve from ATOM and SMARTS for individual pointings. In all panels, only statistical error bars are shown, while horizontal bars mark the observation time.
Current usage metrics show cumulative count of Article Views (full-text article views including HTML views, PDF and ePub downloads, according to the available data) and Abstracts Views on Vision4Press platform.
Data correspond to usage on the plateform after 2015. The current usage metrics is available 48-96 hours after online publication and is updated daily on week days.
Initial download of the metrics may take a while.