Fig. B.4.
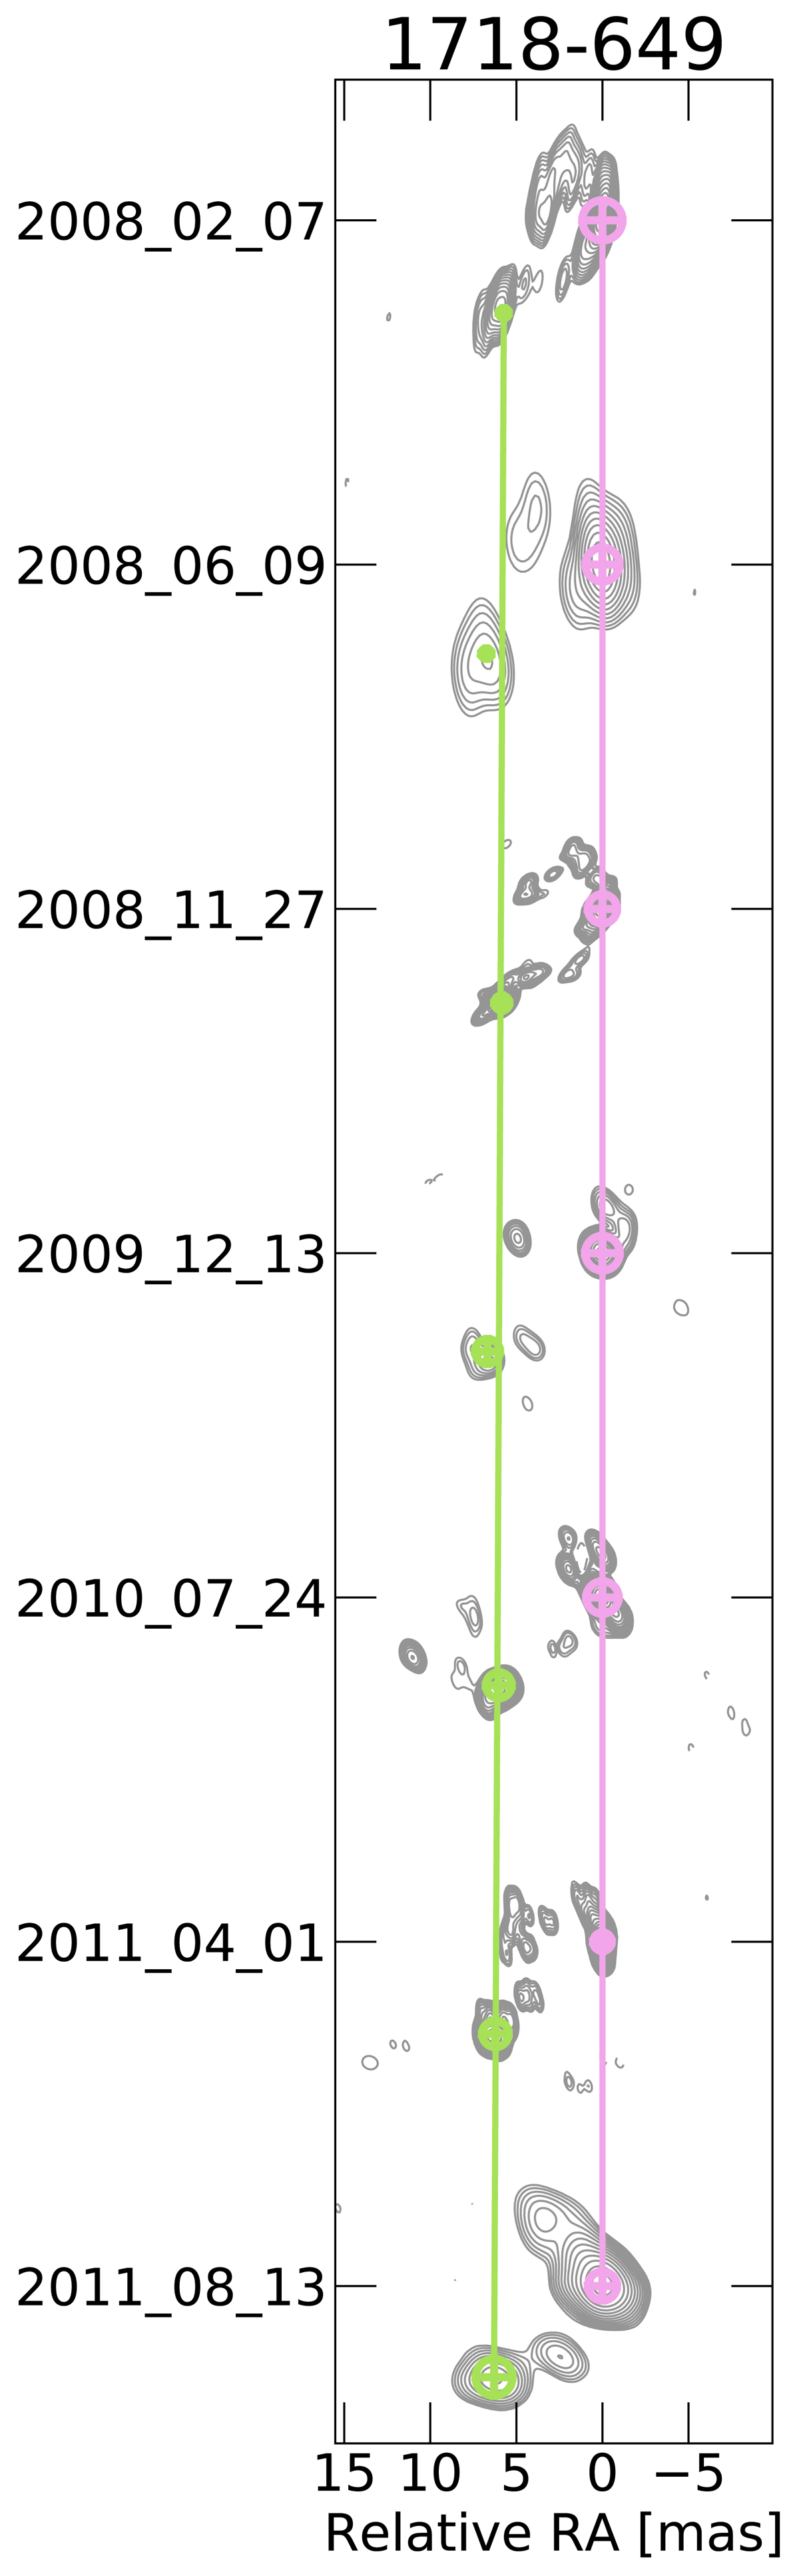
Multi-epoch images of PKS 1718−649. The colored crossed circles represent the circular Gaussian components that have been fit to the clean maps. The distance between the images at different epochs is not to scale. The colored lines are not fits to the displayed component positions, but simple interpolations meant to guide the eye.
Current usage metrics show cumulative count of Article Views (full-text article views including HTML views, PDF and ePub downloads, according to the available data) and Abstracts Views on Vision4Press platform.
Data correspond to usage on the plateform after 2015. The current usage metrics is available 48-96 hours after online publication and is updated daily on week days.
Initial download of the metrics may take a while.