Fig. 16.
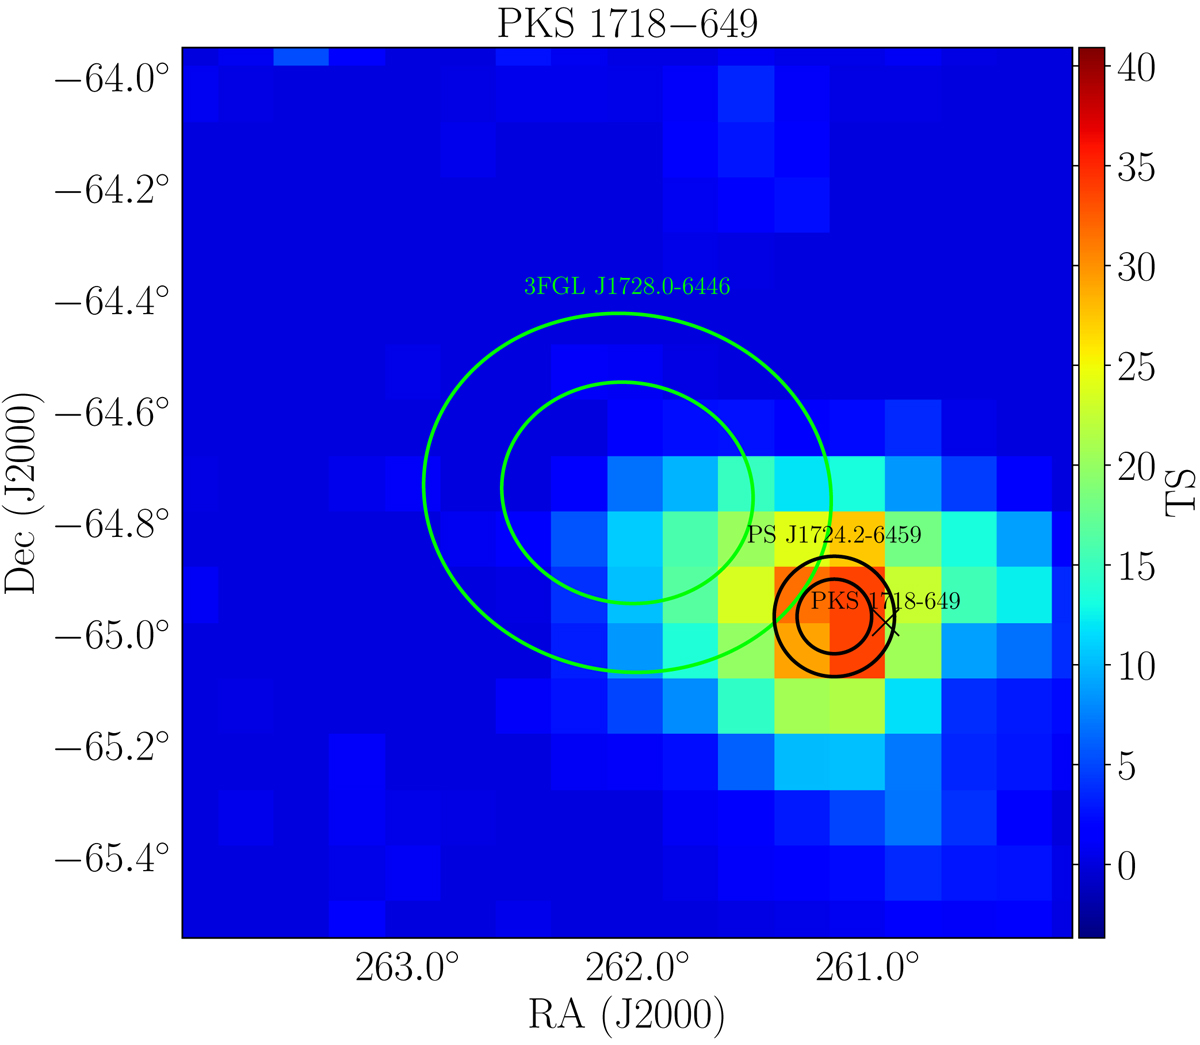
Fermi-LAT map of excess TS in the inner region of the ROI centered on PKS 1718−649, after removing the unidentified catalog source 3FGL J1728.0−6446. The ellipses represent the 68% and 95% confidence positional errors on the catalog source, while the black circles represent the same errors for the new source PS J1724.2−6459. The map size is 1.6 ° ×1.6°. Each pixel corresponds to 0.1°.
Current usage metrics show cumulative count of Article Views (full-text article views including HTML views, PDF and ePub downloads, according to the available data) and Abstracts Views on Vision4Press platform.
Data correspond to usage on the plateform after 2015. The current usage metrics is available 48-96 hours after online publication and is updated daily on week days.
Initial download of the metrics may take a while.