Open Access
Fig. 13.
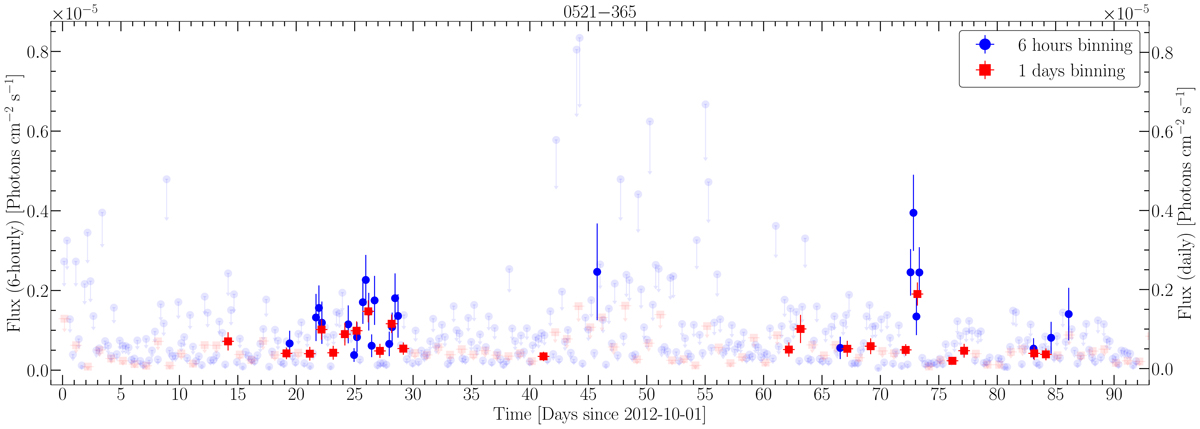
Light curve of PKS 0521−36 (0521−365) between 0.1 and 300 GeV over 103 months of Fermi-LAT data, with 6-h (blue points) and daily (red points) binning. Upper limits are indicated by arrows of the respective colors. The left y-axis reports the 6-h flux values, the right one reports the daily flux values.
Current usage metrics show cumulative count of Article Views (full-text article views including HTML views, PDF and ePub downloads, according to the available data) and Abstracts Views on Vision4Press platform.
Data correspond to usage on the plateform after 2015. The current usage metrics is available 48-96 hours after online publication and is updated daily on week days.
Initial download of the metrics may take a while.