Fig. 7.
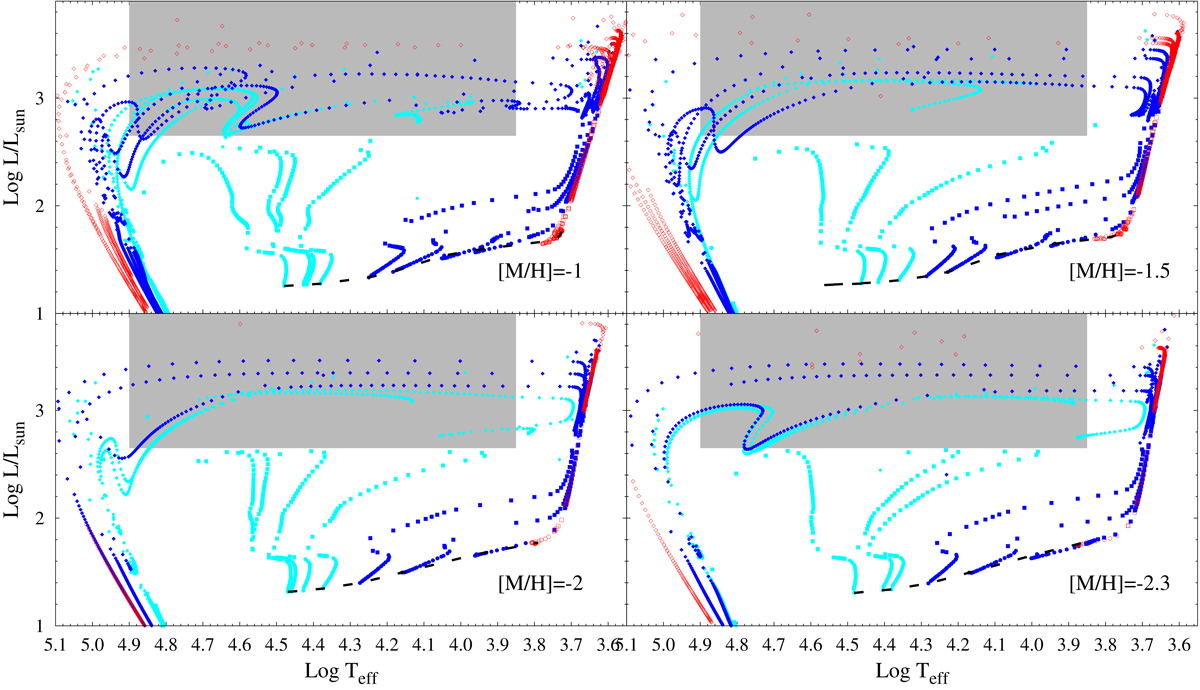
Stellar evolution sequences computed for the present work (see Table B.1 for details). Black circles indicate the location of the HB and are plotted with a time step of 5 Myr, while squares and diamonds indicate the post-HB evolution with time steps of 0.5 Myr and 5 kyr, respectively. Cyan, blue, and red symbols indicate the sequences that populate the extreme, blue, and red parts of the HB. The gray region marks the parameter space of the hot post(-early) AGB stars in Table 9.
Current usage metrics show cumulative count of Article Views (full-text article views including HTML views, PDF and ePub downloads, according to the available data) and Abstracts Views on Vision4Press platform.
Data correspond to usage on the plateform after 2015. The current usage metrics is available 48-96 hours after online publication and is updated daily on week days.
Initial download of the metrics may take a while.