Fig. 3
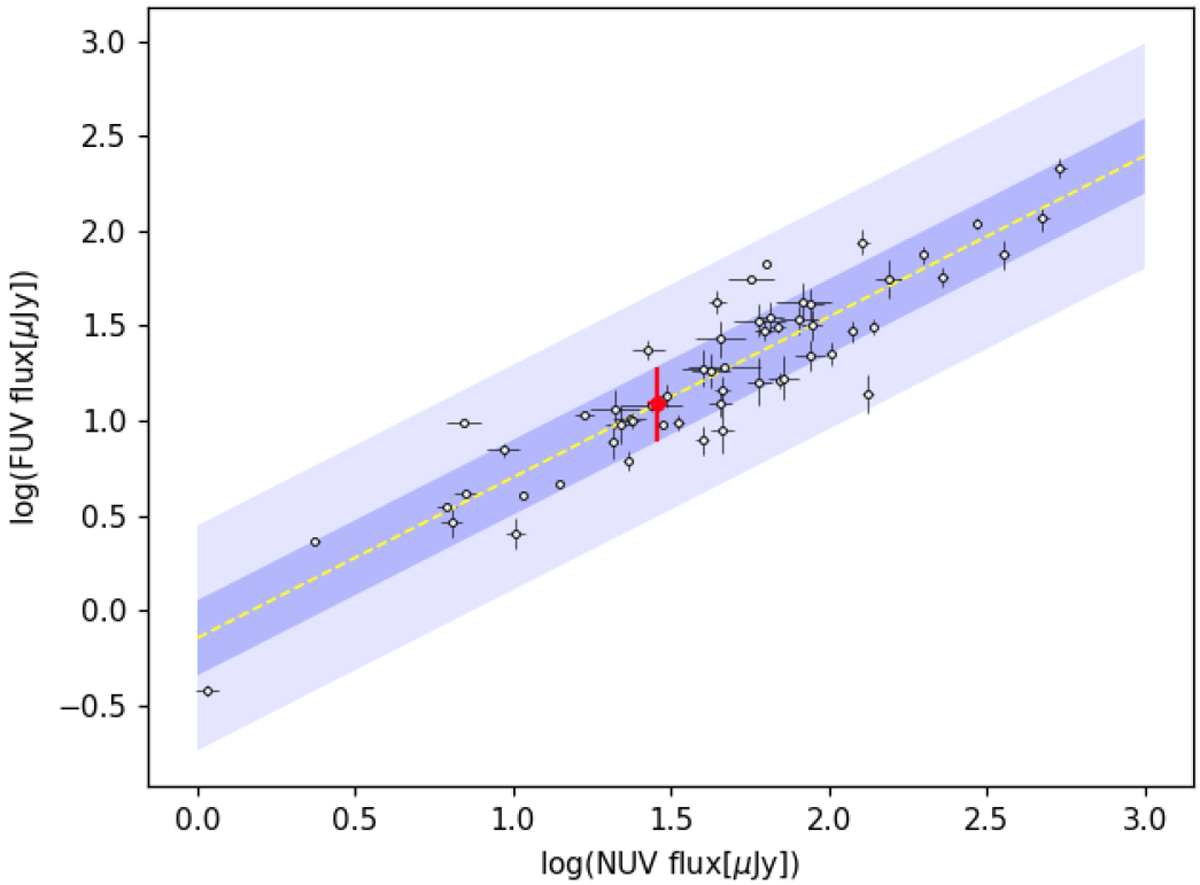
Correlation between the FUVG and the NUVG flux density of M4-M5 stars. The yellow dashed line is the least-squares fit of the data points. The redpoint shows the position of LHS 1140 as obtained through our measure of the NUVG flux density (Sect. 2). The shaded regions mark the 1σ and 3σ dispersion (measured perpendicular to the best fit line) of the data points.
Current usage metrics show cumulative count of Article Views (full-text article views including HTML views, PDF and ePub downloads, according to the available data) and Abstracts Views on Vision4Press platform.
Data correspond to usage on the plateform after 2015. The current usage metrics is available 48-96 hours after online publication and is updated daily on week days.
Initial download of the metrics may take a while.